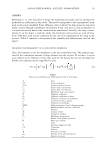
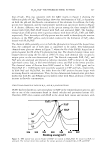
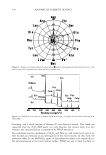
110 JOURNAL OF COSMETIC SCIENCE captured, color corrected, and processed (Optimas software). A center region (570 x 210 mm) was analyzed to eliminate edge effects. Changes in the color intensity of adjacent pixels provided an output parameter related to shadowing in cellulite dimples under compression and designated as the red-band standard deviation (red-band SD). BIOMECHANICAL PROPER TIES The biomechanical properties were measured at the thigh site (2-cm diameter area) using the BTC-2000™ (SRLI Technologies, Nashville, TN) through two cycles over 2 cm at a pressure of 10 mmHg/sec for 15 seconds (150 mmHg, 200 mbar) with five seconds of relaxation between cycles. The measured properties were laxity (acute elastic deforma tion), laxity % (percent, indicates slack or looseness), elastic deformation (total displace ment at maximum pressure), stiffness (slope of the stress/strain curve higher value indicates tighter skin), energy absorption (area under the stress/strain curve, entire deformation response higher values indicate more compliant skin), elasticity (reverse deformation by full-pressure release), and elasticity % (elasticity/elastic deformation x 100% higher values indicate more elastic skin) (2 5 ). NAIVE JUDGE CELLULITE IMAGE ASSESSMENT High-contrast (gray scale) images were viewed on black backgrounds to allow the judge to focus on the image and distinguish the skin surface features. The length of time for the evaluation was optimized to minimize fatigue and maximize response fidelity. At the start of a session, the judge was given descriptors of cellulite (lumps, bumps, dimples, ripples, cottage cheese appearance) and instructed to ignore non-cellulite features (e.g., vertical bands, specks). Responses were made using a 0-9 category scale (Table II). Four assessment schemes (A-D) were used to randomize presentation and ensure that the question sequence was removed as a variable in scoring cellulite severity. Judges first viewed single images to obtain a frame of reference and then evaluated the ten single images of the expert image grading scale. The use of pair-wise comparisons is more effective than subjective rating scales in medical imaging since it allows observers to detect small differences in image quality (26). We used a modified version of the two-alternative forced-choice (TAFC) method in which judges scored each image within a pair. The method assumes that the image with the higher score has the more severe condition (26). Twenty-five randomized pairs of varying differences in severity were evaluated to determine the threshold of incremental discrimination (i.e., grade 1 vs grade 7, a six-increment difference). Pairs of identical images were included as controls. STATISTICAL ANALYSIS The data were analyzed using the Sigma Stat Software (SPSS, Inc.), with a significance level of p 0.05. Results were represented as mean ± SD and mean ± SEM. Student's None Slight cellulite 0 2 3 Table II Ten-Point Category Scale Moderate cellulite 4 5 Severe cellulite 6 7 8 9

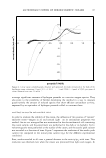
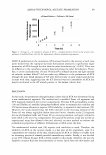
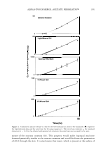
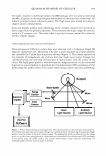
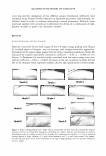
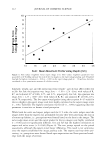
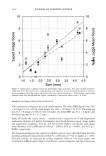
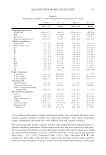
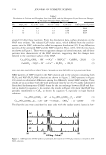
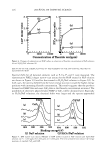
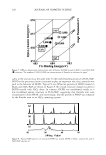
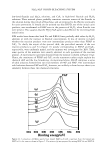
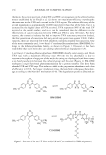
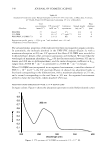
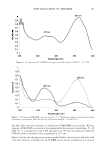
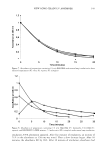
QUANTITATIVE MODEL OF CELLULITE 111 t-test was used for comparison of two different groups. Correlation coefficients were computed using Pearson Product Moment or Spearman procedures (non-normally dis tributed data) in order to evaluate relationships among parameters. Multiple linear regression analyses were carried out to determine the ability of a combination of inde pendent variables to predict the dependent variable. RESULTS QUANTITATION OF CELLULITE SEVERITY Selection criteria for the ten final images of the 0-9 expert image grading scale (Figure 2) included depth of dimples, area of coverage, and cottage-cheese-like appearance. Correlation of the expert image grades with the surface roughness parameters (Table III) indicated the highest association (correlation coefficient = 0.86, p = 0.008) for Svm (Figure 3). Parameter Sdr was also highly correlated with the expert image score (cor relation coefficient = 0.86, p = 0.002). Inclusion of the non-correlated variables Ssk and Sku in the multiple linear regression analysis did not add significantly to either model. Grade 0 Grade 1 Grade 2 Grade 3 Grade 4 Grade 5 Grade 6 Grade 7 Grade B Grade 9 Figure 2. Expert image grading scale. Three experts reviewed 66 3D laser scans that covered the range of severities observed in the general population, identified the cellulite features, and developed a ten-point classification scale of cellulite severity (0-9). A grade of 0 represented no cellulite 1, 2, and 3 indicated varying degrees of slight cellulite 4, 5, and 6 were moderate and 7, 8, and 9 were severe. Ten images, representing each point (0-9), were established as the expert image grading scale and used for evaluation by na'ive judges.
Purchased for the exclusive use of nofirst nolast (unknown)
From: SCC Media Library & Resource Center (library.scconline.org)