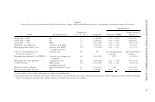
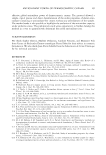
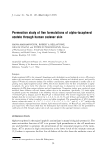
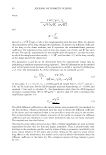
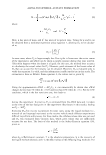
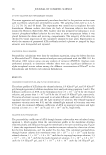
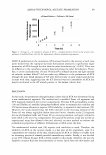
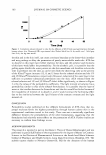
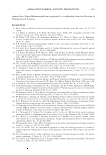
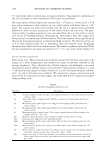
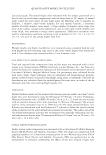
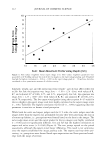
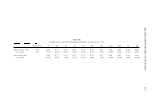
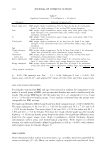
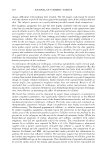
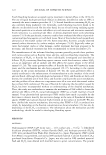
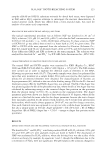
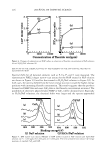
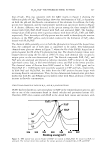
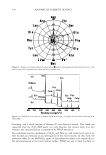
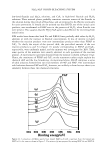
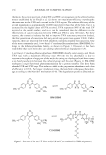
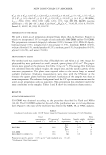
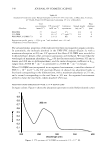
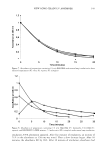
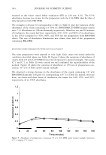
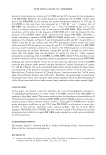
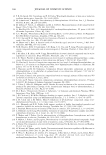
130 JOURNAL OF COSMETIC SCIENCE let Figure 9. Amino acid compositions in human saliva (e) and in stain separated from human teeth (0). The radii of the circles represent the molar percent of amino acid. (a) Ols Cls O(KLL) Nls Ca2p (b) 800 700 600 500 400 300 Binding energy(e V) P2s P2p 200 100 Ca3p 0 Figure 10. XPS wide-scan spectra of human teeth with stain: (a) before and (b) after bleaching with H2O2/NaF. bleaching, and a small amount of fluorine (F) was detected instead. This result has suggested that the H2O)NaF agent not only bleaches the stained teeth, but also enhances the remineralization accompanied by FHAP formation. The individual reaction mechanism of H2O2 and NaF are well understood, and so we have focused our attention on an investigation of the mixed system. In this work, the preventive effect by the NaF/H2O2 agent on discomfort was found to be mainly due to the remineralization at the tooth enamel surface. FHAP was apt to form favorably in

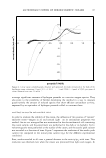
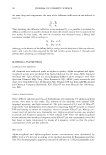
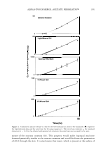
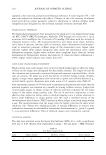
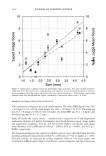
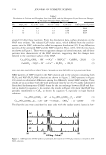
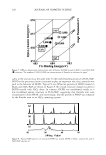
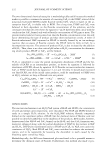
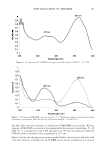
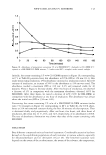
H 2 O)NaF TOOTH-BLEACHING SYSTEM 131 low-level fluoride and H 2 0 2 solutions, and CaF2 in high-level fluoride and H20 2 solutions. These mineral phases probably constitute reservoir sources of the fluoride in the solution during the periods of bleaching, and are proposed to be effective eventually for caries prevention. It should also be pointed out that DCPD, one of the initial caries products, was transformed to FHAP even in the presence of H 2 O 2 , when fluoride ions were present. This suggests that the H2O2/NaF agent is also effective for recovering from initial caries. XPS results have shown that both Fls and F(KLL) lines gradually shift either by H 2 O2 addition or with the increase in fluoride concentration. It was of interest to know whether the reaction products were new intermediate products other than FHAP or CaF2 . To clarify the origin of the spectral shift, the prescribed amount of the two reaction products (a and f in Figure 11) mostly corresponding to FHAP and CaF2 , respectively, were uniformly mixed, and the mixture was investigated by XPS. Then, some spectra of the mixtures were mostly identical to each spectrum of the reaction product. A representative spectrum obtained from the mixture is shown in Figure l l(g). Hence, the coexistence of FHAP and CaF2 on the outermost surface might explain the chemical shift and the line broadening. As mentioned above, FHAP comprises a series of solid solutions formed from two end members of FAP and HAP. The intermediate solid solutions between FAP and CaF 2 , however, are unlikely to form because there is no similarity between these two chemical structures. 604 602 600 598 596 594 592 Binding energy(eV) Figure 11. Comparison of F(KLL) spectra from treated HAP (a-f) with a spectrum from the mixture (g). HAP (a-f) is the same as shown in Figure 5. The mixture (g) was prepared by mixing HAP (a) and HAP (f).
Purchased for the exclusive use of nofirst nolast (unknown)
From: SCC Media Library & Resource Center (library.scconline.org)