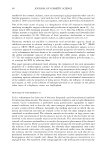
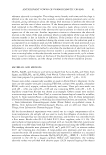
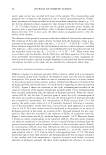
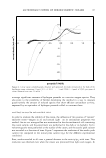
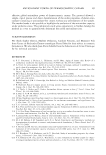
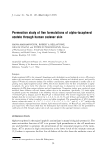
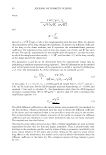
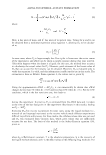
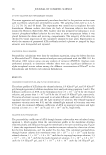
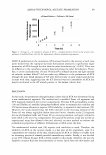
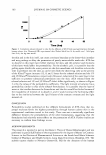
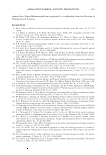
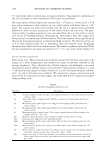
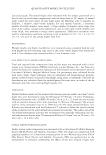
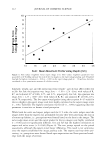
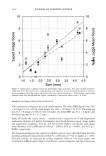
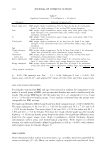
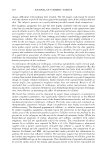
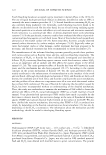
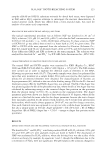
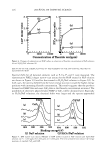
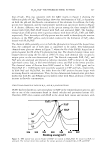
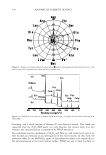
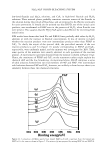
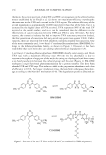
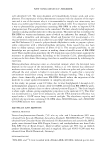
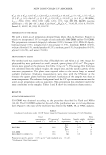
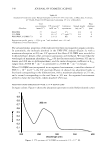
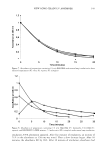
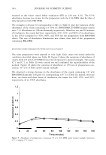
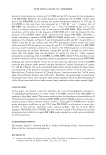
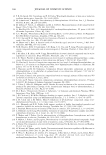
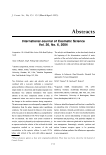
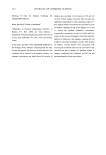
126 JOURNAL OF COSMETIC SCIENCE 1.5 0 ..... � 1.0 0 CCI C)0.5 (b) (a) o ........ __,__._________ ....&,_,_.__......_. 0 5000 10000 0 5000 10000 Concentration of fluoride ion(ppm) Figure 4. Changes of composition on HAP surface as a function of fluoride concentration in NaF solutions (a) and H 2 O2/NaF solutions (6). XPS STUDY ON THE CHEMICAL STATES OF THE ELEMENTS ON THE HAP SURFACE TREATED IN HzO)NAF SOLUTION Spectral shifts for all detected elements such as F, Ca, P, and C were measured. The representative F(KLL) Auger narrow-scan spectra for the HAP treated in NaF solution are shown in Figure 5(1) and for that treated in H2O2/NaF solution in Figure 5(2). In both cases, the spectra shifted from the lower-energy position toward the higher-energy positions with increasing fluoride concentration. This result suggests that the products became less FHAP-like and more CaFrlike as the fluoride concentration increased. The possibility of other new phases besides FHAP or CaF2 will be discussed later. Especially in H2O2/NaF solutions, the chemical shifts were larger and the spectra approached (a) (c) 604 600 596 592 604 600 596 592 Binding energy(e V) (1) NaF solution (2) H202 /NaF solution Figure 5. XPS narrow scan spectra (F(KLL)) of HAP powder treated in NaF solution and H2O2/NaF solution: (a) F = 1,000 ppm (b) 5,000 ppm (c) 10,000 ppm. The vertical dotted lines indicate the energy positions of standard CaF2 and FAP.

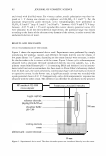
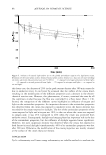
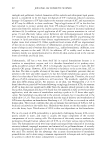
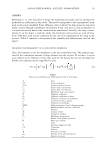
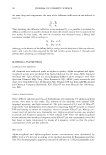
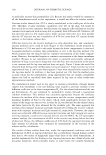
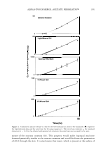
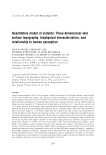
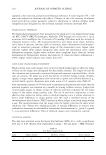
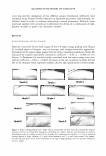
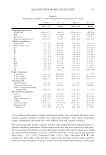
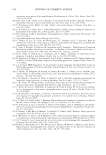
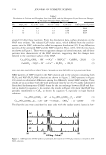
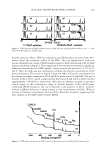
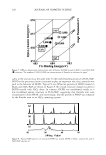
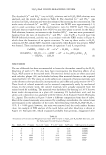
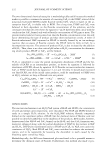
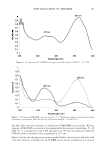
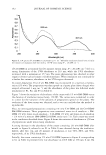
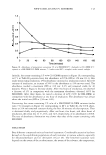
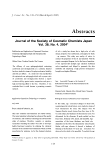
H2O2/NaF TOOTH-BLEACHING SYSTEM 127 that of CaF2 • This was consistent with the XRD results in Figure 2 showing the diffraction peaks of CaF 2 . These findings show that the formation of CaF 2 is dependent on both the pH and the fluoride concentration of the solutions. In addition, the Ca2p spectra were examined, and the representative narrow-scan spectra are shown in Figure 6. A distinct difference was detected in the spectra among the three samples: HAP treated with H 2 O)NaF, HAP treated with NaF, and untreated HAP. The binding energy values of the spectra were in good accordance with those of CaF 2 , PAP, and HAP, respectively. Thus, the analysis of Ca2p spectra was also useful in identifying the reaction products on the HAP surface, and provided evidence for the formation of CaF 2 when treated with H 2 O 2 /NaF. The chemical shifts generally occur on both the photoelectron lines and the Auger lines thus, the combined use of both lines is considered to be useful. Two-dimensional chemical-state plots are shown in Figure 7, where the Ek of the F(KLL) Auger line is plotted against the Eb of the Fls photoelectron line. The observed energy values were charge-corrected using the Cls line at 284.6 eV thus, each chemical state occupied a unique point on the two-dimensional grid. The fluoride compounds FAP, CaF 2 , and NaF were also analyzed and plotted as reference materials. FAP is shown in the upper right-hand corner, CaF 2 in the lower left-hand corner, and NaF in the lowest position. The chemical states of fluorine from HAP treated in NaF (F cc= 1,000 ppm) and in H 2 O 2 /NaF (F ccc 10,000 ppm) were positively assigned to FAP and CaF2 , respectively. In both NaF and H2O2/NaF, the shifts from the FAP position became larger with increasing fluoride concentrations. Thus, the two-dimensional chemical-state plots have shown that both Fls and F(KLL) spectra shifted either with H2O2 addition or with the increase in fluoride concentration. STRUCTURAL CHANGE OF DCPD IN H 2 O 2 AND H 2 O 2 /NAF SOLUTIONS DCPD has been known as a precursor phase to HAP in the remineralization process, and also as one of the constituents found in dental calculus and precarious lesions (43 ). Therefore, DCP often coexists with HAP in the dental hard tissues and interacts with 354 352 350 348 346 344 Binding energy(e V) 342 Figure 6. XPS narrow-scan spectra (Ca2p) of HAP: (a) treated in H 2 O)NaF (b) treated in NaF (c) untreated. The vertical dotted lines indicate the energy positions of standard CaF 2 , FAP, and HAP.
Purchased for the exclusive use of nofirst nolast (unknown)
From: SCC Media Library & Resource Center (library.scconline.org)