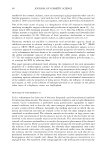
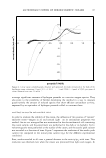
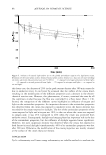
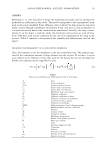
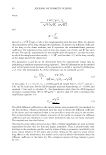
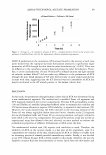
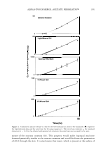
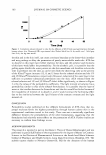
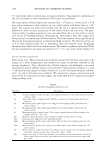
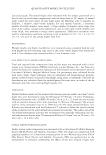
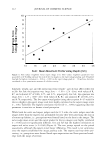
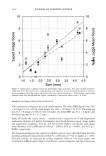
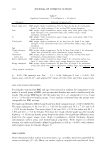
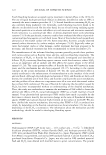
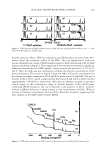
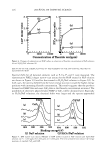
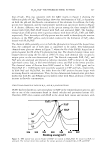
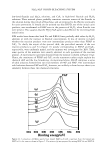
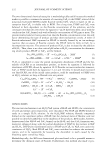
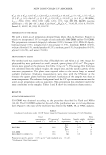
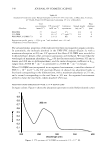
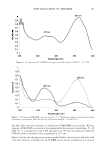
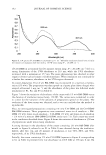
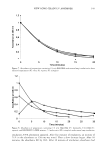
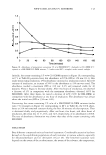
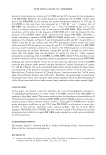
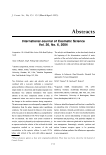
112 JOURNAL OF COSMETIC SCIENCE 10 �---------------------------, 9 8 (I) 7 C) � ctJ o E 6 u- (f) (I) (I) ctJ 5 u ctJ (f) 4 E� t O 3 (I) C) c..2 X ctJ 2 UJU 1 0 1.0 • 1.5 2.0 2.5 3.0 3.5 4.0 4.5 Svm: Mean Maximum Profile Valley Depth (mm) Figure 3. Skin surface roughness versus expert image score. Skin surface roughness parameters were quantified with TrueMap software for each of the ten images on the expert image grading scale. Parameter Svm had the highest correlation (r = 0.86, p = 0.001) to the expert image grade (n = 10) and was, therefore, considered to be a quantitative measure of cellulite severity. Similarly, weight, age, and the interaction term (weight · age) did not affect either Svm or Sdr. For Svm, the equation was: Image Score = -1. 66 + (2.4 · Svm), with values of R, R2 , and adjusted R2 of 0.86, 0.75, and 0.71, respectively. For Sdr, the equation was Image Score= 1.25 + (388 · Sdr)) with values of R, R2 , and adjusted R2 of 0.86, 0.73, and 0.70, respectively. The live expert visual grades (using the ten-point 0-4.S scale) for the ten thighs in the expert image scale were highly correlated to the expert image scores (r = 0.92, Table III). The highest correlation was for Sdr (r = 0.89), suggesting that this parameter is sensitive to human visual perception. While both the nai·ve and expert judges used the 0-9 scale, the na'ive judges rated the images lower than the experts did, presumably because they were processing the data in a bottom-up fashion, i.e., perceptions were formed based on the data in the images. The na'ive judge mean scores and the expert grades for the ten images were highly correlated (r = 0.96) and not significantly different. Svm and Sdr had the highest correlations to expert and nai·ve scores (r 2: 0.86) (Figure 4). The two groups agreed on the paired assessments, although the experts noted larger differences. This result is not surprising, since the experts established the image grading scale. The experts used top-down pro cessing, i.e., perceptions were formed based upon expectations and from previous knowl edge with the range of severity.

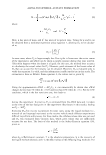
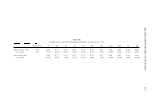
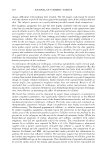
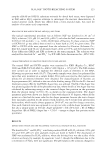
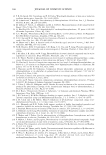
Table III Cellulite Score and Surface Roughness Parameter Correlations (n = 10) Visual score Sa Sq Sp Sv St Ssk Sku Expert image score 0.92 0.76 0.75 0.67 0.67 0.76 0.39 -0.32 (r, p value) 0.00 0.0ll 0.013 0.033 0.033 0.0ll 0.269 0.361 Live visual score 0.82 0.77 0.79 0.51 0.71 0.56 -0.71 (r, p value) 0.002 0.007 0.004 0.126 0.019 0.081 0.019 Spm Svm Sz 0.78 0.86 0.83 0.008 0.001 0.003 0.86 0.83 0.86 0.000 0.000 0.000 Sdr 0.86 0.002 0.89 0.000 12) C � f--1 � f--1 - tTJ � 0 d r 0 'Tj CJ C -r f--1 tTJ """"' """"' v.J
Purchased for the exclusive use of nofirst nolast (unknown)
From: SCC Media Library & Resource Center (library.scconline.org)