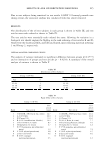
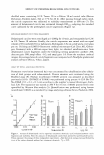
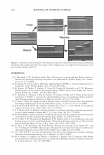
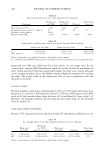
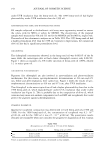
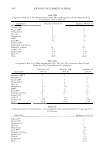
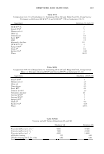
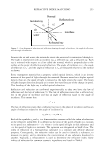
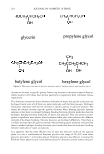
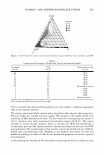
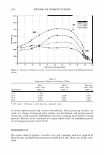
274 JOURNAL OF COSMETIC SCIENCE in the outer cylinder. The sample of microemulsion is contained in the double annular gap between them. The time of measurement was 195 7 s, shear stress CJ was changed in the range of 3. 24 · 1 0 - 2 - 64 mPa, and shear rate --y was changed from 2 . to 5. 0 s - 1 . RESULT AND DISCUSSION VISCOSITY OF MICROEMULSION FORMED IN THE SDS/PENTANOL/WATER SYSTEM The viscosity of the studied system as it goes from the isotropic phase through a lamellar mesophase regime and again to an isotropic phase at high water content is presented in Figure 2. Microemulsion viscosity increases with increasing water content in the system beginning with the value characteristics for pentanol (4.65 mPa · s for l 5°C 2.99 mPa · s for 30 ° C) (40 ). In an inverse micellar solution, the basis for W/0 microemulsion, it reaches a plateau at the value of water concentration, depending on the temperature (40 wt% of water for 15°C 1 0 wt% of water for 40 ° C), which finishes at 72 wt% of water content ( in a bicontinuous part of the phase diagram). Next, the viscosity of the aqueous micellar solution that forms the basis for the 0/W microemulsion decreases and finally reaches the value close to that characteristic for water (Table II). As expected, the increase in the temperature of the system (15 ° C, 22 ° C, 30 ° C, and 40 ° C) caused the microemulsion's viscosity to decrease. These data are in accordance with the well known theoretical fact that the viscosity of material is usually found to decrease with an increase in temperature, assuming no physical/chemical changes are being induced by the applied heat energy (4 2 ,43). Figure 3 presents three examples of so-called flow curves: Figure 3a for the water-in-oil microemulsion (6% SDS, 65 % pentanol, 29% water), Figure 36 for the bicontinuous system (6% SDS, 22% pentanol, 72% water) and Figure 3c for the oil-in-water micro emulsion (6% SDS, 1 % pentanol, 93 % water). For W/0 and 0/W microemulsions the measured viscosity of fluid remains constant independent of the shear rate. These systems demonstrate Newtonian behavior (Figures 3a and 3c). For the bicontinuous system, viscosity decreases as the shear rate is in creased-shear thinning behavior (Figure 36). O ne can notice that the experimental viscosity values are changing in the same manner as those typical for the emulsion system described by Israelachvili (13). The fact outlined above that the bicontinuous phase exhibits non-Newtonian behavior is connected with the large-scale structure in a material. From the statistical picture of a bicontinuous microemulsion, the structure behaves similarly to a highly crosslinked polymer, and consequently rheology similar to that of swollen gels might be expected. However, the microemulsion structure is rapidly fluctuating so that it flows easily, and although snapshots of a polymer gel and a bicontinuous phase might be topologically similar, their dynamic behavior is not at all so (4 4,45). INFLUENCE OF ASCORBIC ACID (AA) ON THE RHEOLOGICAL PROPERTIES OF THE MICROEMULSION REGION OF THE SDS/PENT ANOL/W ATER SYSTEM As follows from our own experiments, ascorbic acid is dissolved/solubilized up to 6 0%

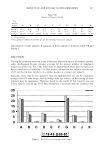
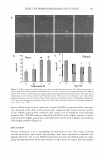
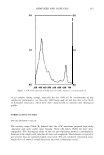
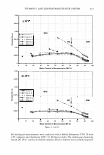
VITAMIN C AND SDS/PENTANOL/WATER SYSTEM 275 in the microemulsion region of the SDS/pentanol/water system (18). The % content of ascorbic acid in the sample ought to be understood as a percent of the total microemul sion weight in this sample. The addition of AA to the system caused reduction of the microemulsion region in the phase diagram. Ascorbic acid serves as a competitive organic anion to the surfactant, changing the W /0 microemulsion system towards an 0/W one. Figure 4 illustrates the influence of ascorbic acid on the rheological properties of the surfactant system. The ascorbic acid addition to the system (2%, 10%, 20%, 60% of the microemulsion weight) caused the increase in the microemulsion viscosity, the highest in the bicon tinuous region (see Figure 4a for 15°C, Figure 46 for 22°C, Figure 4c for 30°C, and Figure 4d for 40°C). One can notice the decrease in the W/0 microemulsion region with the increasing AA concentration, which is consistent with the phase diagram described earlier. As we have already mentioned, the phenomenon of viscosity increasing occurs because the AA presence in the system changes its microstructure. The ascorbic acid, being an electrolyte, causes formation of bigger surfactant aggregates, which contain some amount of the continuous phase. As a result, the volume of the dispersed phase increases, resulting in an increase in the total viscosity of the colloidal system (42). The temperature dependence of viscosity is more clearly seen in Figure 5, where an example for the ascobic acid concentration equal to 20% is presented. There is a great consistency in the results presented above with those discussed earlier (Figure 2) and with the typical viscosity/temperature curves for microemulsions known from data in the literature (13,42,45). 0.014 -----------------------------------, AA70% 0.012 0 +---➔------1.....--.....--....--..... ---+---....--.....---+----I 0 10 20 30 40 50 60 70 80 90 100 Water Content in Microemulsion (Wt%) Figure 5. Influence of temperature on the viscosity of the microemulsion region of the SDS/pentanol/water system (20% ascorbic acid).
Purchased for the exclusive use of nofirst nolast (unknown)
From: SCC Media Library & Resource Center (library.scconline.org)