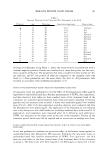
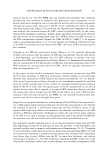
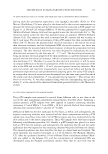
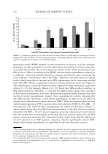
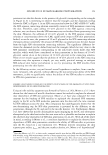
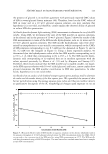
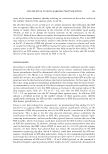
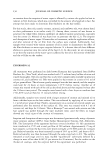
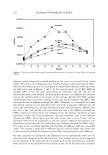
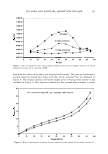
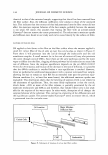
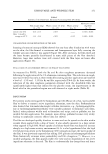
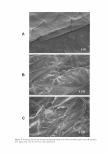
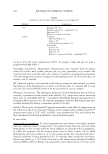
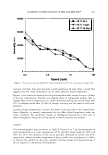
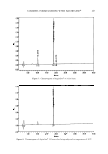
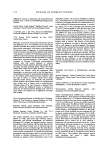
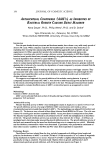
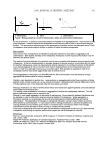
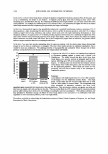
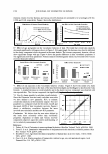
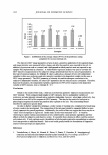
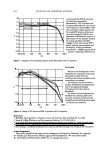
SDS MICELLES IN SKIN BARRIER PERTURBATION 125 the presence of glycerol is in excellent agreement with previously reported CMC values of SDS in water/glycerol binary mixtures (46). Therefore, based on the CMC values of SDS in water and in a 10 wt% glycerol aqueous solution, one may conclude that hypothesis (i) is not valid, and therefore, cannot explain the observed ability of glycerol to reduce SDS skin penetration. (ii) Results from the dynamic light-scattering (DLS) measurements to determine the size of the SDS micelles. Using DLS, we determined the sizes of the SDS micelles in aqueous solutions, in the absence and in the presence of 10 wt% glycerol. Figure 5 shows the results of the DLS measurements in terms of the SDS micelle hydrodynamic radii in: (a) water and (b) 10 wt% glycerol aqueous solutions. The SDS micelle hydrodynamic radii were deter mined by extrapolation to a zero micelle concentration, which corresponds to the CMCs of SDS solutions corresponding to (a), 8.7 mM (see the diamonds in Figure 5), and to (b), 9.2 mM (see the triangles in Figure 5). Using a linear regression analysis, we determined that the hydrodynamic radius of the free SDS micelles corresponding to (a) is 19.5 ± 1 A, while that corresponding to (b) is 18.5 ± 1 A. The SDS micelle hydro dynamic radii corresponding to (a) reported here are in excellent agreement with the values reported previously by Moore et al. (11) and by Almgren and Swamp (47). Therefore, these results indicate that the SDS micelle size is slightly smaller, not larger, in the SDS aqueous solution with 10 wt% added glycerol, and hence, cannot explain how glycerol minimizes the SDS micellar contribution to SDS skin penetration. In other words, hypothesis (ii) is not valid either. (iii) Results from an analysis of the hindered-transport aqueous porous pathway model to determine the radius and the number density of the skin aqueous pores. We quantified the extent of skin barrier perturbation using the average aqueous pore radius and the pore number density as quantitative descriptors of the SC morphological changes upon exposure to: (a) an 20 € 19.5 +----------r--------- ➔ ----------t 19 ·e ! 18.5 , "C "C 18 , -� 17.5 in in 17 16.5 0 10 15 20 25 30 35 Concentration of SDS Micelles (mM) Figure 5. Measured effective radii of SDS micelles in aqueous solutions in the absence (diamonds) and in the presence (triangles) of 10 wt% glycerol plotted versus the SDS concentration minus the CMC, which corres1-1onJs to the concentrat.i.on of the SDS m.i.celles, us.i.ng DLS nieasurements at 25 ° C. The SDS micelle radii were determined using a CONTIN analysis. The error bars reflect standard errors based on six samples at each SDS concentration.

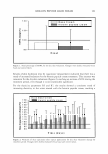
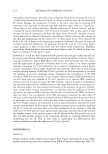
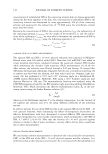
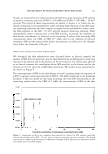
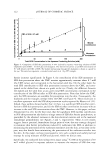
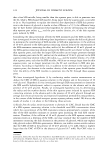
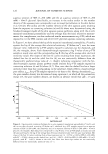
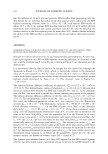
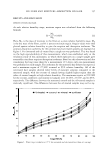
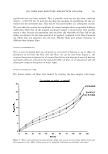
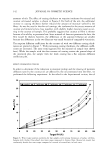
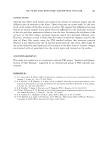
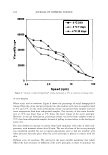
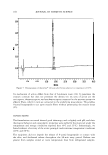
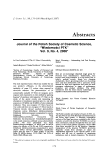
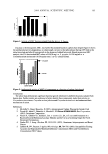
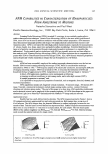
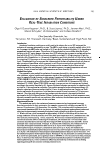
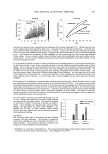
126 JOURNAL OF COSMETIC SCIENCE aqueous solution of SDS (1-200 mM) and (b) an aqueous solution of SDS (1-200 mM) + 10wt% glycerol. Specifically, an increase in the radius and/or in the number density of the aqueous pores corresponds to an increased perturbation in the skin barrier (1,6,7, 10,42). The radius and the number density of the skin aqueous pores resulting from the exposure to contacting solutions (a) and (b) above were determined using the hindered-transport model of the skin aqueous porous pathways, along with the in vitro mannitol transdermal permeability and the average skin electrical resistivity measure ments. For completeness, we also conducted similar measurements on p-FTS, which was exposed to: (c) the PBS control, and (d) 10 wt% glycerol aqueous contacting solutions. In Figure 6, we have plotted the log of the mannitol transdermal permeability, P (cm/h), against the log of the average skin electrical resistivity, R (kohm-cm2), over the same exposure time, exhibited by p-FTS samples exposed to solutions (a), the diamonds, and (b), the triangles, above. Each diamond/triangle represents a log P value of one p-FTS sample at steady state and the corresponding log R ( the log of the average skin electrical resistivity value). The slopes of the best-fit curves resulting from linear regressions, the dashed line for (a) and the solid line for (b), are not statistically different from the theoretically predicted slope value of -1, thereby indicating consistency with the hin dered-transport aqueous porous pathway model analysis for p-FTS samples exposed to contacting solutions (a) and (b) above (6,7). Also, note that the dashed line has a larger intercept value than that corresponding to the solid line, which reflects a larger average pore radius, r pow for p-FTS samples exposed to (a) than to (b). Having determined r pore • the pore number density was determined using equation 6, in which all the parameters, except eh, the pore number density, are known in advance (recall that dX = 15 µm) -2.15.---------------------------------------, -3.25 - -3.50 -:: -3.15 -4.00 -4.25 -4.50 -4.75.._ ___ ....__ ___ ___. ___________ __,_ _______________......______. 0.00 0.20 0.40 0.60 0.80 1.00 1.20 1.40 1.60 log R (kohm-cm2) Figure 6. Experimental correlation between the in vitro mannitol transdermal permeability, P (cm/h), and the in vitro skin electrical resistivity, R (kohm-cm2), exhibited by p-FTS samples exposed to an aqueous solution of SDS (1-200 mM), the diamonds, and to an aqueous solution of SDS (l-200 mM) + 10 wt% glycerol, the triangles. Each data point corresponds to a log P value of one p-FTS sample at steady state and the associated log R, the log of the average skin electrical resistivity value over the same time period. The slopes of the best-fit curves resulting from a linear regression are: (i) -0.9768 ± 0.06 for SDS (1-200 mM), with R2 = 0.9636, shown as the dashed line, and (ii) -1.0453 ± 0.06 for SDS (1-200 mM) + 10 wt% glycerol, with R2 = 0.9653, shown as the solid line. Note that these slope values are not statistically different from the theoretically predicted value of -1.
Purchased for the exclusive use of nofirst nolast (unknown)
From: SCC Media Library & Resource Center (library.scconline.org)