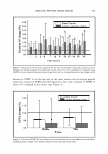
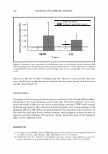
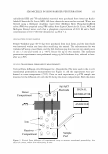
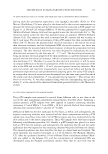
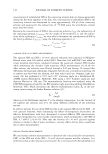
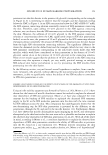
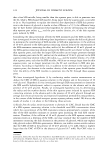
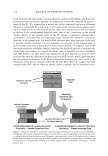
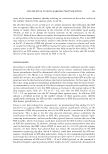
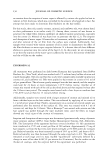
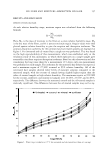
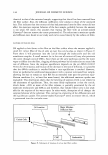
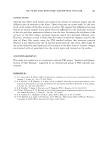
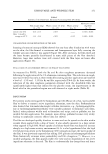
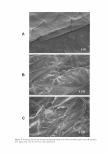
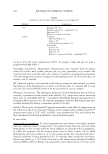
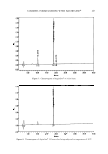
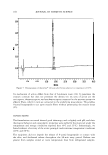
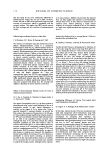
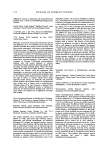
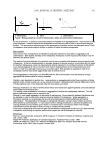
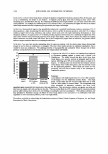
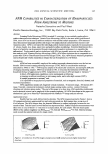
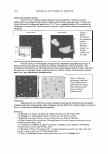
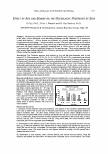
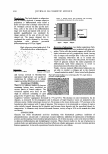
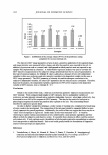
196 JOURNAL OF COSMETIC SCIENCE Application foundation powder Figure 2 shows foundation powder deposited on the gl-substrate. Particles or particle agglomerates can be characterized in terms of radius, height, volume, and aspect ratio. A larger scan reveals that most of the deposited particles are 103-317 nm. A magnified image of 3 x3 µm shows the morphology of nanoparticles. The circles shown on figure 2 (right) indicate how particle radius being calculated. P�rticl:, Analyskl Parttc:e Analysis Figure 2. Height distribution for foundation powder particles. 40x40µm image is on the left 3x3µm is on the right . Material sensing or vibrating phase imaging modes compliment topography data (Figure 3). Material sensing mode produces an image that contrasts the difference in elastic properties. The foundation powder particles are softer than substrate. Phase mode images of particles can be analyzed in the same way as topography images. Particles need to be outlined, counted, and measured to generate particle size, area, and perimeter distribution data. Conclusions Figure 3. 20x20 µm topography ( left-hand side and phase mode( right-hand side) images of foundation powder. Images obtained simultaneously. Applications for the AFM in the cosmetic industry include particle characterization and surface roughness and texture measurements. Major advantages of using AFM in the cosmetic industry are that it is easy to use and requires minimal sample preparation. References 1.G. Binning, C.F. Quate, Ch. Gerber, E. Weibel, Phys.Rev.Lett. 49, 57-61 (1982) 2.G. Binning, C.F. Quate and Ch. Gerber, Phys.Rev.Lett. 56, 930-933 (1986) 3.D.Bonnell, Scanning Probe Microscopy and spectroscopy, Wiley-VCR, 2001 4.S. Dror, Scanning force microscopy: with applications to electric, magnetic and atomic forces, Oxford University Press, 1994 5. J.C. Hooton, C.S.German, S.Allen, M.C.Davies, CJ.Roberts, S.J.B. Tendler, P.M.Williams, Pharmaceutical research,21,953-961,2004 6.N.Starostina, P.West, Proceedings of the 33 annual international waterborne, high-solids, and powder coating symposium, 307-320, February 2006 7.P. West, N. Starostina, Advanced Materials & Processes, 35-37, February 2004

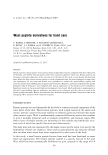
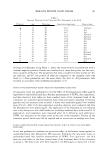
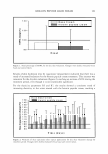
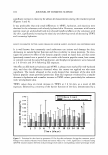
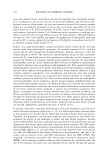
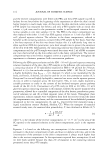
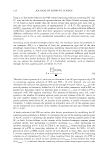
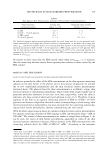
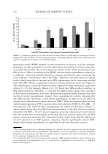
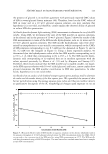
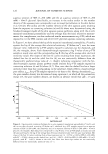
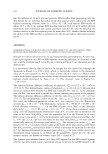
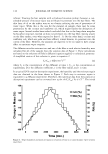
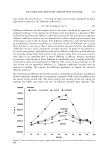
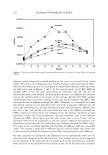
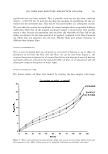
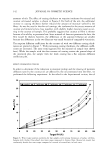
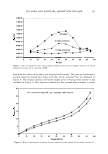
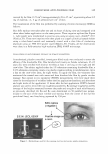
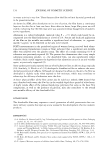
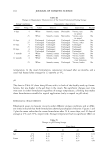
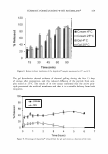
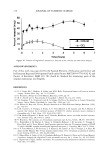
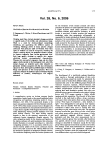
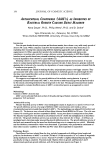
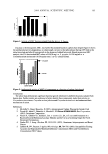
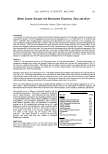
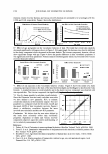
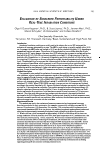
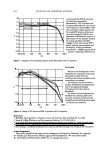
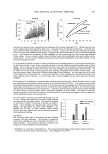
2006 ANNUAL SCIENTIFIC MEETING 197 EFFECT OF AGE AND GENDER ON THE f!ISCOELASTIC PROPERTIES OF SKIN Di Ou, Ph.D., Chris J. Masotti and G. Paul Seehra, Ph.D. ARTISTRY Research & Development, Access Business Group, Ada, Ml Summary: The physical properties of skin are frequently measured using a variety of mechanical devices. In this study, we have developed a new data analysis technique with the Cutometer 575 to characterize "overall skin elasticity." We also propose two additio new physical parameters which correlate to chronological and photo-ageing -"viscous and elastic recovery." This study was conducted on 430 subjects of different ase, sender and ethnicity. Using a novel type of area lysis of the Cutometer displacement time cwve, the results s gest a significant decreasing trend in "elastic recovery" with qe, while the "viscous recovery" showed no significant change over the same age span. These unique parameters offer more accwacy than existing outputs from the Cutometer, and may provide increased sensitivity in skin-care efficacy testing than existing methods. Introduction: The Cutometer measures skin elasticity in vivo and bas been frequently used in skin research [I,2]. Many parameters, Uf, Ue, Uv, Ur, Ua, Ue/Uf, Ur/Uf, and Ur/Ue, an: measured in an attempt to describe skin's mechanical response. The elasticity of skin has been reported to decrease with age using Cutometer and Twistometer, but changes in the viscous component has not been consistent [3,4]. This may be related to differences in the determination of the inflection point on the curve. The Cutometer software traditionally approximates the point as 0.1 second after vacuwn is off. In this study, we show that our calculated time is lower tlwt the 0.1 sec estimate. Accurate detennination of the inflection point results in a more accurate analysis of the viscoelastic property of the skin. Using the point together with area analysis, we have attempted to obtain a more precise description of skin elasticity by separating the elastic and viscous components of the viscoelastic behavior. This presentation shows the application of the new analysis method in human skin elasticity studies. Material and Methods: Cutometer SEM575 (CK Electronic GmbH) with a 2-mm aperture probe was used in this study. All measurements were taken in the lab Wlder controlled temperature and hlDllidity (20-22°C, 45-50% RH). Measurement Mode I was employed with a negative pressw-e at 500 mbar. The suction time and vacuum release times w re each set at 1 second. Measurements were taken on the cheeks of 430 male and female subjects ased from 20 - 69 years old. Major ethnic groups included Asian, Caucasian, and Hispanic. The subject demography is shown in Figure I. Linear parameters of Cutometer results v.-cre compared with the area parameters and three new linear parameters were established to define three viscoelastic properties of skin. A silicone rubber block of known hardness was used as an elastic standard. Results and discussioDJ: 20-29 Figure 1 30.39 40.411 I. Definition of skin elasticity using area parameters. Our analysis of the Cutometer displacement-time cwve lead us believe that an area ratio of relaxation and extension is the most appropriate method to analyze Cutometer data. An ideal elastic material such as a silicone rubber standard recovers a displacement completely after release of tension,and therefore the area ratio of recovery (B) and extension (A) is I. Human skin, being viscoelastic in nature, exhibits two components in the recovery area, an elastic recovery area Bg, and a viscous recovery area Bv. Using these areas, the overall elasticity, elastic component, and viscous component can be determined. II. Detennination of the inflection point on the relaxation curve. This point represents the elastic recovery time, fllR, at. which the relaxation curve deviates from its initial linearity and indicates the separation of elastic and viscous recovery components. We developed a computational algorithm to calculate la from each Cutometer curve. The results from the 430 subjects showed an average of 0.068 second with a standard deviation of 0.012. m. Distribution of kin el ti.city, elastic recovery fraction, and viscous recovery fraction. Using the definition and method described above we analyzed the Cutometer cwves of 430 subjects. The overall
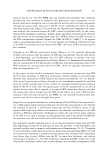
Purchased for the exclusive use of nofirst nolast (unknown)
From: SCC Media Library & Resource Center (library.scconline.org)