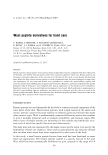
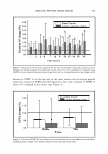
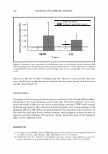
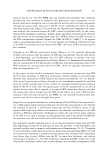
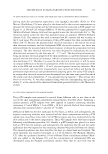
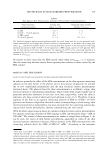
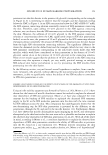
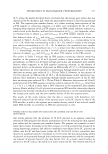
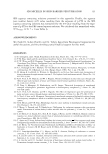
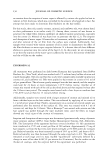
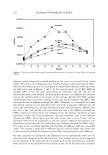
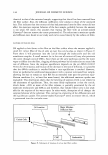
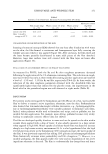
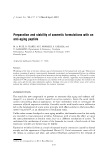
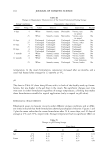
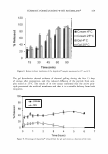
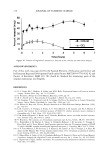
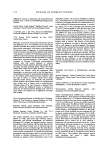
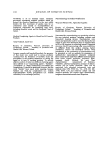
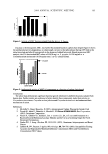
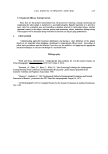
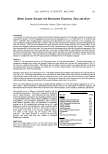
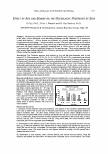
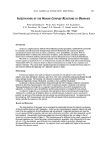
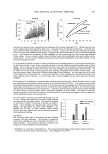
202 2.50 2.00 1.50 1.00 ! 0.50 8 0.00 "' -0.50 -1.00 -1.50 JOURNAL OF COSMETIC SCIENCE 1.57 1.36 0.21 0.29 0.29 0.07 -0.86 -2.00 ..._ ____ _._ ______ __..__,&...,_ __________ _.___.__ Glycerin Olibanum Peppermint R. Chamomile Lavender Samples Lemon B. Chamomile Figure I. Distribution of the average values (N=l4) of the preference rating parameter for various essential oils. The objective GOV image parameters of area of glow, geometric mriformity of the captured image, and image intensity were measured before, during, and after the panelists were exposed to the oils. In addition, glycerin was used as a control, and a backgrowul in which panelists were not exposed to any samples was implemented as a baseline. A multi.variable regression analysis was used to correlate the GOV objective measurements to the subjective ratings determined from the two sets of questionnaires. In this type of statistical analysis, the Multiple R value is utilized as a measure of how well independent variables (in this case, preference and odor intensity) correlate to the dependent variable (in this case, a GOV image parameter). The GOV parameter of intensity showed the strongest correlation to the subjective independent variables the other GOV parameters did not indicate such a correlation. Therefore, based on the analysis, the independent variables explained over 90% of the response in the dependent variable of GOV intensity that is, Multiple R 0.9. Conclusions Based on the results of this study, a link may exist between panelists' subjective measurements and GOV intensity. When compared individually to GOV intensity, the two independent variables of preference and odor intensity showed only a moderate relationship however, when taken collectively, they accounted for over 90% of the response in GOV intensity. This may be the result of a biological or physiological response elicited by the panelists after exposure to the oils. This relationship should therefore be explored in greater detail. In order to further validate this technique, a wider variety of essential oils, comprised of a broad rang, of notes, needs to be investigated. The composition of the test panel should be expanded further to more closely represent the general population. Additionally, the results of this test suggest that there may be an "ideal" level of exposure to a given oil. In this study, all oils were evaluated "as is". It would be interesting to explore various concentrations of oils, solubilized by a non-aromatic ingredient, and their effects on both the subjective and objective scales. It is possible that a plateau in effect could be reached with certain oils. If such a plateau exists, the addition of oils beyond a particular concentration or exposure level may provide no additional benefit. Such a .tool could greatly benefit the formulation of fragrances used in various personal care applications. References 1. Vainshelboim, A., Hayes, M., Momoh, K., Peirce, S., Raatsi, C., Korotkov, K. Investigation of conscious and subconscious human reactions to pme essential oils, Proceedings of JSOEN 11 th International Symposium on O/faction and Electronic Nose, 266-269 (2005).

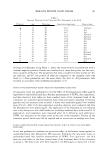
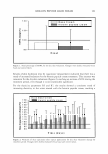
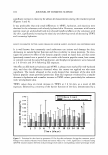
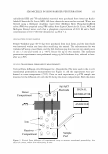
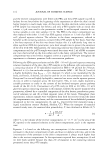
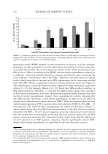
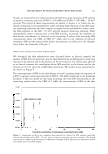
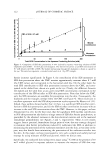
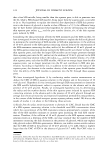
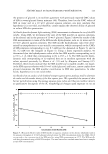
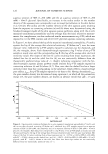
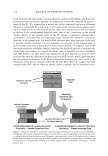
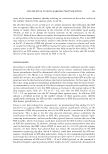
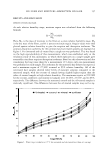
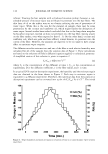
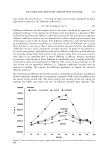
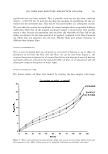
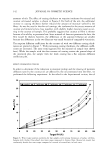
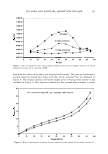
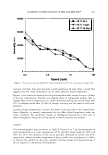
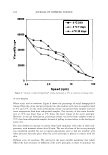
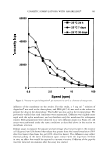
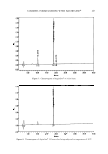
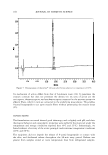
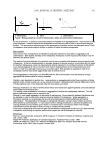
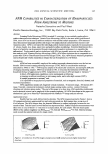
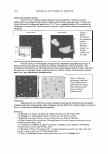
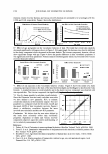
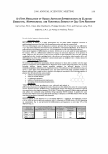
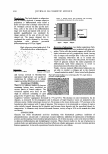
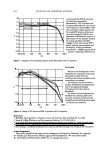
2006 ANNUAL SCIENTIFIC MEETING EVALUATION OF SUNSCREEN PHOTOSTABILITV UNDER REAL--TIME IRRADIATION CONDITIONS 203 Olga V. Dueva-Koganov1, Ph.D., B. Scott Jaynes1, Ph.D., Jianwen Mao 1, Ph.D., Marcel Schnyder2, Uli Osterwalder3 and Colleen Rocafort 4 Ciba Specialty Chemicals, Inc. 1 Tarrytown, NY, 2 Grenzach, Germany, 3 8ase/, Switzerland and 4 High Point, NC Introduction Accelerated irradiation conditions are widely used in the industry for in vivo SPF testing and the evaluation of sunscreen photostability in vitro. The MED in such testing is typically reached within 10-20 sec. In contrast. the MED under real sunlight is 10-20 min for fair-skinned individuals (1. 2]. depending on geographical location and season. The emission of the accelerated test source differs from that of solar radiation in the UV region because it has more short UVB radiation than is present in sunlight and has less than half of the UV A-1 (340-400 nm) intensity available in sunlight [I]. At high intensities of light. the quantum yield of degradation, i.e .• the amount of degradation per photon absorbed will often be less than at low intensities [3]. Sunscreens on skin are subjected to sunlight. elevated temperatures and certain humidity levels. Thephotostability of a sunscreen that is detennined on the basis of irradiance levels only does not take into account these effects, which are present in real-life environment and can contribute to the photodegradation of sunscreen actives. Florida climate provides increased levels of three critical weathering variables simultaneously: higher solar radiant exposure, increased temperatures and more moisture. Arizona climate has higher UV, temperatures and lower humidity [3]. Method Description The proposed in vitro method for evaluation of sunscreen photostability utilizes real-time exposure. solar irradiation, relative humidity and temperature similar to the conditions that are relevant to sunscreen users, for example Florida, Arizona, or other regions. It employs a Ci65A Xenon Weather-0-Meter, VITRO-SKIN� N-19 (IMS, Inc.) [4) or PMMA (DIN 8201-5) as the substrates and a transmittance analyzer with integrating sphere (PerkinElmer Lambda 35 with RSA-PE-20, Optometries SPF-290S or Labsphere lN-1 OOOS). When VITRO-SKIN was used, it was pre-cut into 4x4 cm pieces and hydrated according to the protocol described in [4]. A piece of hydrated substrate was mounted in a glassless slide, air-dried for 15 min and used as a reference. Test product was applied on the substrate according to [4), placed in a glassless slide mount and air-dried for 15 min. An application dose was 2 mg/sq. cm. Each product was tested at five repetitions. Initial absorbance spectra of tested sunscreens in UV region were obtained. The slides with references and test products were then placed in the sample holders and positioned in the Ci65A Xenon Weather-O-Meter. Irradiation time, humidity level and temperature were adjusted to resemble specific end-use conditions. After irradiation, the absorbance spectra were measured again and comparisons were made with the initial data. Experimental Results This method was used in the evaluation of numerous commercial and experimental sunscreen formulations and also for their optimization. For example, commercially available sunscreen SPF 45 (actives: 2% avobenzone, I 5% homosalate, 5% octisalate, 7.5% octinoxate and 6% oxybenzone) and experimental formulation SPF 28 in vivo (actives: bis-ethylhexyloxyphenol methoxyphenol triazine and methylene bis-benzotriazolyl tetramethylbutylphenol) were evaluated at the following conditions: 1.1 W/m2 at 420 nm, which corresponds to approximately 50 W/m2 at 300-400 nm and is close to an average irradiation in Florida humidity level 65% black panel temperature 60 °C irradiation time 2 hrs. The results are presented in Fig. I and 2, respectively. We have also evaluated the photostability of a commercial sunscreen SPF 15 containing 3% avobenzone, 2% octisalate and 7.5 % octinoxate under conditions described above and found that the average UV A PF decreased by more than 800/4. Several prototypes were created and tested. Prototype A contained 3% avobenzone, 2% octisalate and 7.5 % octinoxate Prototype B contained the same actives as in A plus 2% bis-ethylhexyloxyphenol methoxyphenol triazine Prototype C contained the same actives as in A plus 2% methylene bis benzotria.zolyl tetramethylbutylphenol (based on active level) and Prototype D contained the same actives as in A plus 1.5% methylene bis-benzotriazolyl_ tetramethylbutylphenol (based on active level) and 1.5 % bis-ethylhexyloxyphenol methoxyphenol triazine. Prototype A was not photostable. In contrast. Prototypes B, C and D were photostable, and a significant boost in SPF/PF A in vitro was achieved in these prototypes. Thus, we have found that methylene bis-benzotriazolyl tetramethylbutylphenol, b1s-ethylhexyloxyphenol methoxyphenol triazine, or their combination effectively photostabilize avobenzone and our finding regarding prototype B are consistent with data presented in (5).
Purchased for the exclusive use of nofirst nolast (unknown)
From: SCC Media Library & Resource Center (library.scconline.org)