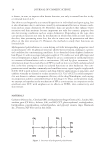
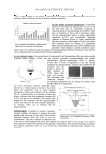
JOURNAL OF COSMETIC SCIENCE 2 BASELINE SWEAT COLLECTION Gravimetric baseline sweat values were determined and used to compare the differences be- tween the highest and lowest average rate of sweat output among the test subjects. The FDA monograph (2) requires that within a selected panel of test subjects, the difference between the subject with the highest rate of sweat and the subject with the lowest rate of sweat must exceed 600 mg of sweat/20 min/axilla during the baseline sweat collections. In addition, a subject must produce ≥ 100 mg of sweat/20 min/axilla during the baseline sweat. SUPERVISED AXILLARY WASHES A mild bar soap was used for all supervised axillary washes. Supervised axillary washes were conducted prior to each test article application. TEST ARTICLE APPLICATION Assignment of test articles and placebo was randomized to the right and left axilla. Sub- jects in each study received approximately four daily treatment applications (two studies required only two applications). The test articles were applied at a rate appropriate for the product form and were applied to uniformly cover approximately a 4×6-inch area cen- tered in the axillary vault. No other axillary products were permitted to be used during the active treatment period. SWEAT COLLECTION INTERVALS Sweat collections were conducted at baseline and approximately one and 24 hr following application No.4 for six of the studies and approximately one hour after application No. 2 for two of the studies. SWEAT STIMULATION Sweating was induced by having the subject sit erect in a room maintained at 100°F ± 2°F, with the relative humidity in the range of 30% to 40%. SWEAT COLLECTIONS During the initial 40 minutes of the sweat stimulation period, the subject held un- weighed pads of Webril (non-woven cotton padding fabric) in their axillae. This pre- liminary warm-up period was followed by two successive 20-min collection periods, during which the subjects held weighed Webril pads in the axillae. These pads were weighed in tightly capped polystyrene vials before and after use. The vials were labeled with the subject’s number and axilla and collection designation. The fi rst collection made with weighed pads was designated Collection B and the second Collection C.

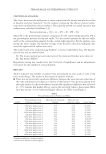
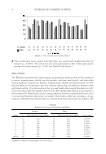
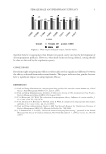
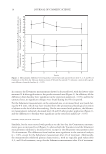
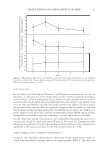
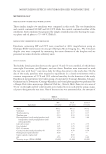
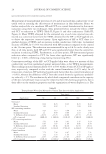
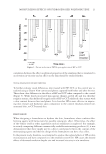
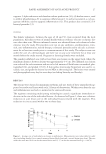
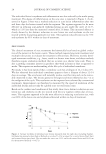
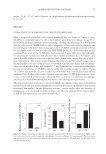
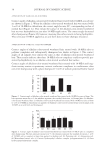
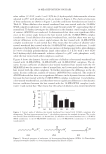
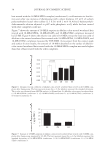
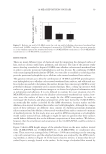
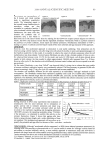
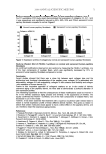
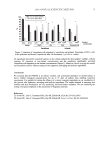
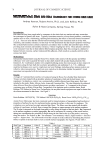
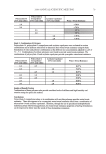
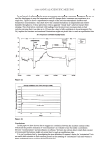
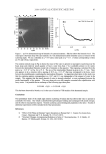
FEMALE/MALE ANTIPERSPIRANT EFFICACY 3 STATISTICAL ANALYSIS The source data were the milligrams of sweat output from the treated and placebo axillae at baseline and post-treatment. For the analysis comparing the effi cacy, percent reduc- tions were calculated for each test subject. The adjusted treated-to-control ratios for this analysis were calculated as follows (3,4): Percent reduction = 100 × {1 − (PC × T) / (PT × C)} where PC is the pretreatment measure of moisture for the control axilla (placebo), PT is the pretreatment measure for the test axilla, T is the treated measure for the test axilla, and C is the corresponding quantity for the control axilla (placebo). For the analysis com- paring the sweat output, the baseline average of the B and C collection milligram data across the right and left axillae were used. The study results were analyzed using Student’s t-test for independent data. The hypoth- eses for this test are shown below. Ho: The means (output/percent reductions) of the males and females were identical. Ha: The means differed. Hypothesis testing was conducted at the 0.05 level of signifi cance and no adjustments were made for the number of tests performed. RESULTS Table I indicates the number of subjects that participated in each study as well as the basic study design. The results of the statistical analyses indicate: O There was no statistically signifi cant difference between the mean percent reductions of the male and female test subjects in twelve of the fourteen time points analyzed from the eight studies. In the study where a statistically signifi cant difference was indicated (p 0.5), females had higher effi cacy, and in the one study where a directional differ- ence was seen (p 0.10), males had higher effi cacy. See Table I and Figure 1. Table I Percent Reductions for Females and Males Study Post-treatment sweat collection time point Mean percent reduction: females Mean percent reduction: males t-test p-value 1 1 Hr after application 2 27% 23% 0.5000 2 1 Hr after application 2 33% 43% 0.2924 3 1 Hr after application 4 40% 29% 0.0451* 3 24 Hr after application 4 36% 37% 0.5000 4 1 Hr after application 4 42% 40% 0.5000 4 24 Hr after application 4 35% 28% 0.2799 5 1 Hr after application 4 35% 40% 0.0844** 5 24 Hr after application 4 27% 28% 0.5000 6 1 Hr after application 4 34% 38% 0.5000 6 24 Hr after application 4 29% 30% 0.5000 7 1 Hr after application 4 23% 28% 0.4150 7 24 Hr after application 4 20% 20% 0.5000 8 1 Hr after application 4 43% 31% 0.2385 8 24 Hr after application 4 42% 32% 0.1064 *Signifi cant difference (females higher). **Directional difference (males higher).
Purchased for the exclusive use of nofirst nolast (unknown)
From: SCC Media Library & Resource Center (library.scconline.org)