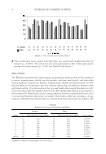
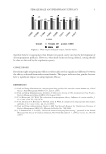
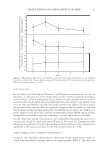
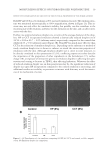
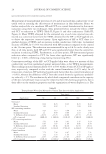
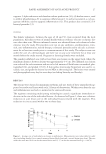
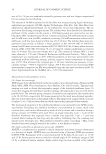
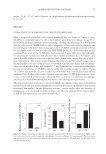
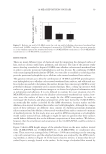
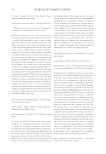
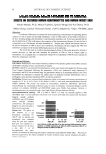
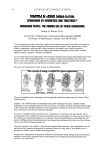
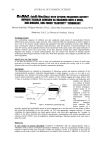
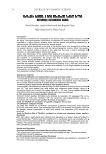
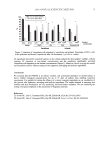
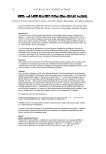
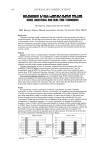
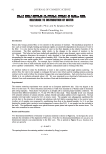
MOISTURIZING/ANTI-SEBUM EFFECTS ON SKIN 9 other skin diseases and allergy, or participation in any other study. An informed consent form was obtained and signed by each subject. FACIAL SKIN WATER CONTENT, TEWL, AND SEBUM SECRETION MEASUREMENTS Skin water content was estimated with a CM 825 Corneometer (Courage + Khazaka Company, Cologne, Germany), and the results were expressed in arbitrary units (a.u). TEWL was measured using a TM 300 Tewameter (Courage + Khazaka) and expressed in g/h.m2. Facial sebum secretion was measured using an SM 815 Sebumeter (Courage + Khazaka) and expressed in μg/cm2. TEST PROCEDURE Before each test, the subjects cleaned their faces with a standard lotion according to a standard procedure and rested for 30 min in the air-conditioned laboratory with a con- stant 22° ± 1°C room temperature and 50 ± 5% relative humidity. The subject’s cheeks were used as test areas. For the kinetics test, one 3-cm × 3-cm area on one cheek was treated with product 1, product 2, and then with product 3, and the corresponding area on the other cheek was left untreated as a control according to permuting order. Measurements were taken 0, 2, 4, and 8 h after product application, with an amount equaling 2 μl/cm2 or 2 mg/cm2 on the fi rst day. For the three-week test, the cheeks were treated with product 1, product 2, and then with product 3, with no control area. Measurements were taken once a week over a period of three weeks, and the subjects were instructed to use the products twice a day at home. At the end of the last test, the 8-h kinetics test was performed again, as on the fi rst day, and the subjects fi lled out a questionnaire to present their feelings about the products after using them for three weeks. STATISTICAL ANALYSIS The difference between the measurements was statistically evaluated with analysis of variance (ANOVA) and the Student’s t-test. The p value of 0.05 was considered signifi - cant. STATISTICA 7.1 (Statsoft Company, Tulsa, OK) software was used. RESULTS KINETICS TESTS ON THE FIRST DAY For the areas treated with products on the fi rst day, the Corneometer measurements gave an increased level, with the highest value measured 4 h after application (Figure 1). All the differences from baseline were signifi cant in the statistical analysis ( p 0.05), whereas for the untreated area almost constant levels were found during the 8-h test period.

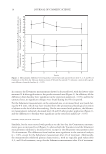
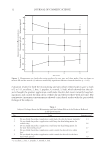
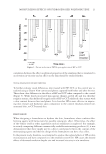
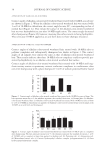
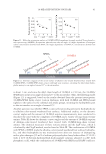
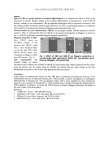
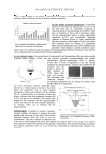
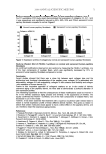
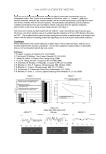
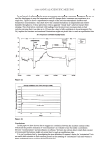
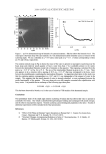
JOURNAL OF COSMETIC SCIENCE 10 In contrast, the Tewameter measurements showed a decreased level, with the lowest value measured 4 h after application to the product-treated area (Figure 1). In addition, all the differences from baseline were signifi cant in the statistical analysis (p 0.05), and for the untreated area, no signifi cant changes were found during the 8-h test period. For the Sebumeter measurements on the untreated area, an increased level was found dur- ing the 8-h time, which may have resulted from the spontaneous physiological secretion of sebum on the facial skin after washing. On the area treated with products, the Sebume- ter measurements indicated a decreased level 4 h and 8 h after product application (Figure 1), and the differences to baseline were signifi cant in the statistical analysis (p 0.05). KINETICS TESTS ON THE LAST DAY Similarly, for the areas treated with products on the last day, the Corneometer measure- ments gave an increased level (Figure 2), whereas both the Tewameter and the Sebumeter measurements exhibited a decreased level, except for the Sebumeter measurement after 2 h of treatment. The differences from baseline were signifi cant in the statistical analysis (p 0.05), except for the Sebumeter measurement after 4 h of treatment. Additionally, the measurements exhibited plateau characteristics, with no typically peak values after 2, 4, and 8 h of treatment, except for the Sebumeter measurement after 2 h of treatment. Figure 1. Measurement difference between product-treated area and untreated area after 0, 2, 4, and 8 h of treatment on the fi rst day. Data are shown as mean ± SD and the asterisk (*) indicates a statistically signifi - cant difference from the baseline (p 0.05).
Purchased for the exclusive use of nofirst nolast (unknown)
From: SCC Media Library & Resource Center (library.scconline.org)