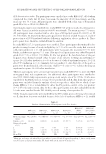
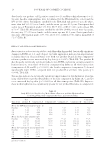
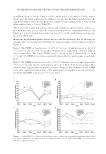
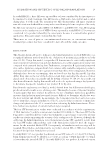
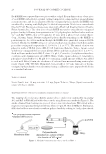
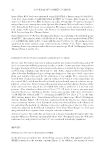
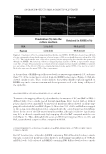
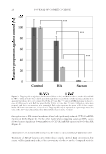
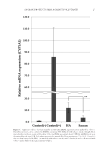
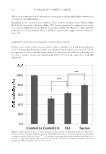
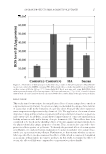
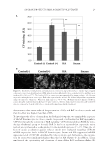
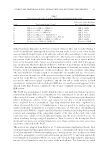
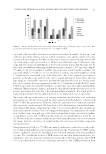
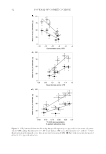
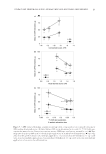
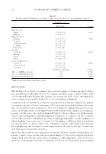
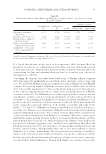
JOURNAL OF COSMETIC SCIENCE 38 DATA AND STATISTICAL ANALYSIS SAS (SAS, Cary, NC), JMP™ (SAS), and SigmaPlot (Systat Software, San Jose, CA) software were used for statistical analyses. A p-value 0.05 was used to determine statistical signifi - cance. The two clinical skin hydration measures (corneometer reading and visual dryness by expert grader) conducted in the FCAT were analyzed using a mixed model analysis of cova- riance. Analyses modeled subject as a random factor, and side, site, and treatment as fi xed factors. Baseline measurement and age were tested for signifi cant effects as covariates for both clinical measures. Based on these results, baseline measurement was used as a covariate for corneometer readings, whereas baseline measurement and age were used as covariates for visual dryness. Studentized residuals beyond four standard deviations were assessed as pos- sible outliers however, no outliers were removed in the fi nal analyses. Results are reported as adjusted mean change from baseline (CFB). Individual surfactant components extracted from either tape strips or cup scrubs in the FCAT study were calculated as masses extracted, and arithmetic means were reported. Ratios of masses extracted by tape strips to masses extracted by cup scrubs were calculated for each subject, and medians were reported. Re- sults from the ex vivo surfactant-skin penetration study were log10-transformed to achieve normality, and a two-way analysis of variance (ANOVA) with treatment and skin donor as the factors was used to obtain the least squares mean and standard error of the mean (SEM) for each test formulation. The geometric mean and standard error were calculated from these values and reported. Comparisons across the in vivo and ex vivo methods were com- pared using linear regression. Pairwise correlations using means were determined using Pearson’s Chi-squared test. RESULTS Results from the FCAT and 14 C-SDS skin penetration studies are provided in Table II. Clinical mildness is associated with higher corneometer readings (skin hydration) and lower visual dryness scores. The use of all test formulations led to signifi cant reductions in skin hydration and signifi cant increases in visual skin dryness versus baseline values. The mildest formulation (G) demonstrated a 5.2 decrease in corneometer reading with a 0.7 increase in dryness score, whereas the least mild formulation (A) demonstrated a 13.1 decrease in cor- neometer reading and a 1.5 increase in skin dryness score. Mean corneometer and visual dryness scores yielded similar rankings with respect to formulation-induced skin dryness. The clinical measures were found to correlate well with 14 C-SDS skin penetration ex vivo (corneometer reading, R2 = 0.75, p 0.05 visual dryness scores, R2 = 0.78, p 0.01). Comparisons of tape strip and cup scrub extractions are listed in Table III. We found the ratio of surfactant mass extracted by fi ve pooled tape strips to surfactant mass extracted by cup scrubs to be 40–59%. Quantities of individual surfactants extracted from fi ve pooled tape strips and cup scrubs are listed in Table II and illustrated in Figure 1. SLE1S penetration into the skin as measured by cup scrubs in vivo was found to correlate well with 14 C-SDS skin penetration ex vivo (R2 = 0.76, p 0.05) (Figure 2). Signifi cant and nearly signifi cant relationships emerged between CAPB penetration into the skin from cup scrub and tape strip in vivo and ex vivo skin penetration results when examining the anion-based test formulations only. CAPB penetration into the skin as measured by cup scrubs in vivo approached a signifi cant correlation with 14 C-SDS skin penetration ex vivo (R2 = 0.95, p = 0.15) for the anion-based systems (Figure 3). CAPB

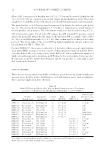
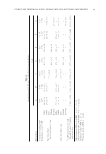
Table II Results from the FCAT and 14 C-SDS Skin Penetration Studies Measurement Code A B C D E F G Corneometer reading,CFB a –13.09 –8.48 –10.92 -8.89 -8.10 -11.58 -5.16 Visual dryness score,CFB b 1.489 1.082 1.164 1.064 0.911 1.365 0.736 Tape strip extract (fi ve pooled extracts),μg c SLE1S 48.4 ± 6.6 29.9 ± 3.6 30.5 ± 4.5 15.0 ± 2.0 17.8 ± 3.8 49.9 ± 7.1 – CAPB 23.8 ± 3.3 40.3 ± 5.5 – – – 22.9 ± 3.2 7.8 ± 1.4 SCG – – 55.5 ± 8.8 – – – – NaLAA – – – 11.1 ± 1.7 11.8 ± 3.2 – – EcoSense – – – – – – 25.5 ± 3.2 Cup scrub extract,μg c SLE1S 79.5 ± 7.3 45.5 ± 4.2 71.6 ± 14.1 37.1 ± 4.1 30.8 ± 3.5 87.4 ± 9.5 – CAPB 51.7 ± 5.3 83.9 ± 9.5 – – – 55.8 ± 7.2 15.9 ± 2.1 SCG – – 65.7 ± 12.9 – – – – NaLAA – – – 28.9 ± 3.9 28.6 ± 3.9 – – EcoSense – – – – – – 71.3 ± 9.8 14 C-SDS penetration into and through the skin,% d applied radioactive dose 0.247 ± 0.044 0.106 ± 0.018 0.198 ± 0.035 0.175 ± 0.030 0.087 ± 0.015 0.277 ± 0.048 0.095 ± 0.016 a Adjusted mean CFB pooled SEM = 0.35, n = 22–24. b Adjusted mean CFB pooled SEM = 0.055, n = 22–24. c Arithmetic mean ± SEM, n = 11–26. d Geometric mean ± SEM, n = 12–14. SURFACTANT PENETRATION INTO HUMAN SKIN AND RESULTING SKIN DRYNESS 39
Purchased for the exclusive use of nofirst nolast (unknown)
From: SCC Media Library & Resource Center (library.scconline.org)