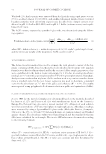
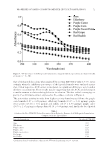
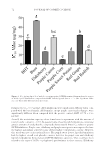
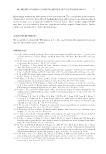
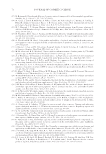
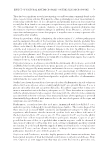
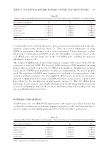
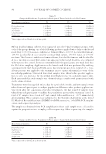
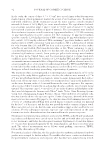
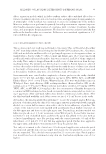
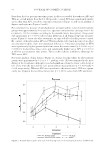
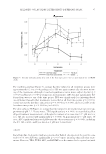
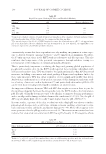
JOURNAL OF COSMETIC SCIENCE 96 Data from the four postexposure time points in this test revealed that whereas AFC and TFG are overall milder than the 1% SLS positive control, TFG was signifi cantly milder on the skin than AFC, based on corneometer measures (Figure 1) and visual grading of dryness and erythema (Figures 2 and 3). For corneometer (a measure of skin hydration), average baseline values for all treatment groups were approximately 30 (a unit-less capacitance measure that can range from 0 for no water to 120 for on water, according to the manufacturer’s description). One percent SLS signifi cantly (p 0.0001) reduced skin hydration at all four postexposure measure- ments (Figure 1) versus the other treatments, an expected effect for this positive control. By contrast, although neither AFC nor TFG was shown to be harsh in terms of an effect on corneometer values, there were signifi cant differences. Corneometer readings for TFG were signifi cantly higher (greater hydration) versus the water control (p 0.0006 to p 0.0001) for the last three time points, and signifi cantly higher versus AFC (p 0.0001) at all four posttreatment time points. These results indicate a mildness advantage for TFG versus AFC. For visual grading of skin dryness (Figure 2), average baseline values for all treatment groups were approximately 0.4 (on a 0–5 grading scale). SLS was numerically the most drying of the treatments, although it reached signifi cance from the water control only at two of the four (the fi rst and the last) posttreatment measurements (p = 0.018 and p = 0.038, respectively). Whereas AFC was equivalent to the water control, TFG was signifi - cantly less drying at the last three time points (p 0.0001) versus both AFC and water. Figure 2. Fore arm dryness grades after each of the four exposures to the test materials in the 1-d RIFT study.

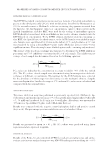
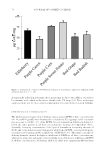
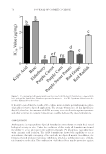
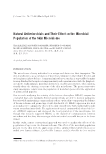
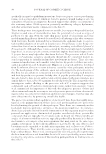
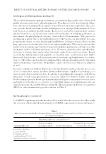
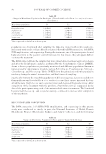
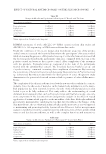
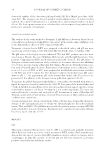
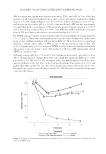
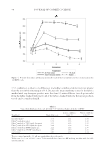
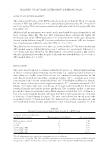
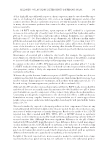
MILDNESS OF LAUNDRY DETERGENTS DIFFERING IN pH 97 For erythema grading (Figure 3), average baseline values for all treatment groups were approximately 0.2 (on a 0–4 grading scale). SLS was again numerically the most irritat- ing of the treatments, although it reached signifi cance versus water only at the fi rst (p = 0.0019) and last (p = 0.049) postexposure measurements. AFC was not signifi cantly dif- ferent from water at any of the time points. TFG was signifi cantly less irritating (based on erythema) than all other treatments: versus SLS at all four time points (p 0.0001), versus water at the last three time points (p = 0.0004 to p 0.003), and versus AFC at the last three time points (p 0.0001 to p = 0.0009). For skin surface pH (Figure 4), average baseline values for all treatment groups were ap- proximately pH 5.5. Versus water, TFG signifi cantly (p 0.0001) increased skin pH at all posttreatment measurements, although the numerical increase was 0.25 pH units or less. SLS also increased pH signifi cantly (p 0.0001) by approximately 0.5 pH units. Of note, AFC signifi cantly increased pH versus the other treatments (p 0.0001), including the 1% SLS control, and by as much as 1 pH unit versus water. 21DCIT Data from this 21-d patch study are presented in Table I. As expected, the positive con- trol (0.05% w/v SLS) was signifi cantly (p 0.05) more irritating than all other treat- ments. However, TFG, TPFG, AFC, and AFCMP were determined to be equivalent (with Figure 3. Forea rm erythema grades after each of the four exposures to the test materials in the 1-d RIFT study.
Purchased for the exclusive use of nofirst nolast (unknown)
From: SCC Media Library & Resource Center (library.scconline.org)