JOURNAL OF COSMETIC SCIENCE 94 Statistical analysis of the data was performed with SAS Proc Mixed procedure (SAS, Cary, NC). The average score for each panelist and treatment across 21 d were used in a mixed effect model with panelist as a random effect, and treatment and site as fi xed effects. The least squares means were calculated for each treatment along with the dif- ferences for each pair of treatments. ANALYTICAL pH EVALUATIONS The authors of this study wished to determine if pH differences between diluted deter- gent solutions or detergent-washed fabrics in contact with sensitive skin could play a role in the skin mildness effects of TFG compared with AFC. Treatment solutions for the RIFT were prepared as described earlier, and pH was mea- sured using a SevenCompact S210 pH meter (Mettler-Toledo, LLC, Columbus, OH). The pH values of the highly viscous undiluted TFG and AFC products were also mea- sured using a Thermo Electron (Waltham, MA) system: gel-fi lled pH/Automatic Tem- perature Compensation (ATC) triode with an epoxy body electrode. The pH values of detergent solutions and titrations of the solutions to determine their reserve alkalinity (22,23) were measured using a Metrohm AG (Tampa, FL) system: Titrando titration sys- tem with a Unitrode glass electrode. For titration to determine reserve alkalinity, solu- tions (10% w/v) of TFG or AFC were prepared in distilled-deionized water, and then 0.2 N HCl was used to titrate the 10% detergent solutions from their basic pH values down to pH 5.5, the approximate pH of the normal skin surface (24). The result is ex- pressed as % free alkaline in the detergent using published equations (22,23). To measure the pH of detergent-washed fabrics, cotton fabric was washed with water or liquid detergent as described earlier for the 21DCIT. Five gram of the washed fabric and 50 mL of distilled-deionized water were placed in a glass jar and capped, and the content stirred with a magnetic stir bar at 500 rpm for 2 h at room temperature. The water was removed from the container and analyzed for pH determination using a Metrohm AG Titrando system with a Unitrode glass electrode. Four replicates of fabric under each wash condition were carried out. Statistical analysis was carried out as follows. Fabric pH data were obtained by taking the average of two internal replicates to obtain two external replicates for each treatment (water, TFG, and AFC). The pH data were modeled separately using a one-way ANOVA with a fi xed effect for each treatment. Treatments were considered statistically different based on a type I error rate of 0.05. RESULTS RIFT This study contained three positive controls. AW is a commercially available detergent which has been used as a positive control in previous RIFT studies (P&G manufacturer data on fi le). Because of concerns that AW formulations may be subject to changes, which could impact its skin effect profi le, 0.5% SLS and 1% SLS were evaluated as alternate positive controls for this and future studies.

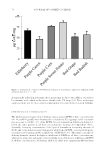
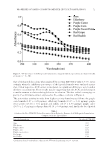
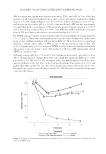
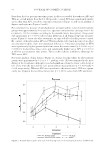
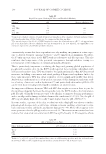
MILDNESS OF LAUNDRY DETERGENTS DIFFERING IN pH 95 AW detergent was signifi cantly harsher than water, TFG, and AFC in four of the fi ve measures at all four posttreatment time points: lower corneometer reading (less hydra- tion) (p 0.0001), higher dryness score (p 0.0001), higher erythema score (p 0.01), and increase in skin surface pH (p 0.0001) (data not shown). AW was also signifi cantly less mild than both concentrations of SLS at all time points in dryness grade (p 0.0003) and increased skin surface pH (p 0.0001). Yet, AW was milder than both concentra- tions of SLS at all time points in the corneometer reading (p 0.0001). For TEWL (data not shown), average baseline values for all treatments were approximately 6.0–6.5 g/m2 h. There was substantial variation in the values within each of the treat- ment groups, making treatment differentiation diffi cult. Thus, there were no signifi cant differences among water, AFC, or TFG at any of the measurement time points. SLS (0.05%) signifi cantly (p 0.02) increased TEWL at only the fi rst and third posttreatment time points versus the water control. Yet, neither 1% SLS nor AW signifi cantly altered TEWL at any time point. Although numerically the 0.5% and 1% SLS treatments were nearly equivalent in their effects on skin (data not shown), there were some small but signifi cant differences. Com- pared with 0.5% SLS, the 1% SLS treatment led to less skin hydration (based on corne- ometer readings) at the last three of the four posttreatment time points (p 0.03), and higher skin surface pH at the last three of the four posttreatment time points (p 0.02). For simplicity in presenting the data, only the 1% SLS data are presented as the positive control in the fi gures. Figure 1. For earm corneometer measurements for hydration after each of the four exposures to the test materials in the 1-d RIFT study.
Purchased for the exclusive use of nofirst nolast (unknown)
From: SCC Media Library & Resource Center (library.scconline.org)