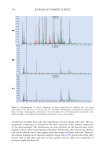
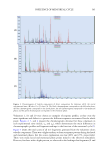
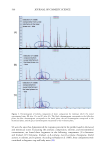
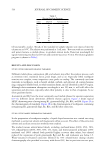
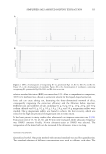
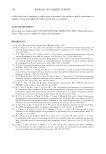
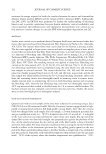
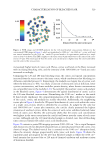
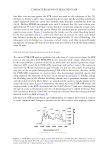
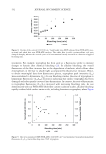
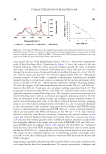
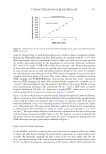
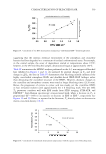
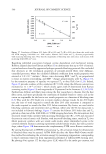
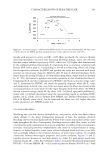
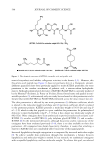
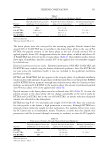
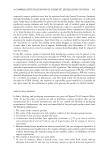
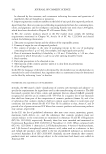
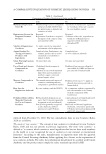
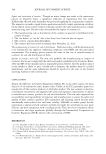
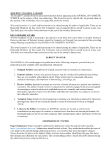
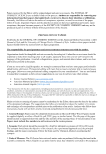
534 JOURNAL OF COSMETIC SCIENCE the Raman hair map. In fact, the Kuzuhara results align with amino acid analysis work published by Robbins, which advocates that phenylalanine is present in both the cuticle and cortex (1). Although the bulk Raman methodology used in our studies does not offer the compartmental selectivity asserted in the confocal studies of Pudney, the work is in line with Kuzuhara. For example, the 1003 cm−1 phenylalanine band was present in the cuticle as well as the cortex, which is assumed to be the bulk of the cross-sectioned fiber. With some exceptions, both cortex spectra from cross-sections (assuming cuticle contributions do not exceed 7–8% of the total signal) and cuticles largely reflect their spatial origination with superior signal-to-noise ratios over their confocal Raman microscopy counterparts. With the reasoning stated previously, Figure 10 displays overlaid Raman spectra from microtomed hair cross-sections collected at 0 and 240 min bleaching times. Immediately visualized is the increase in the 1040 cm−1 band intensity at 240 min bleaching. It should be noted that some background fluorescence in the 0 min bleached sample made the loss in the 509 cm−1 shift band a little less apparent however, integrating both band intensity Figure 10. Raman shift intensity spectra for 0 and 240 min bleaching times. Note the appearance of the 1044 cm−1 (-SO3−) peak after bleaching the fibers for 240 min. Figure 11. Raman scattering shifts as a function of bleaching time. Note the complimentary decrease in -S—S- (cystine) and increase in -SO3− (cysteic acid). Phe: phenylalanine (1003 cm−1).

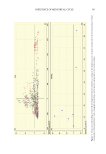
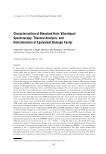
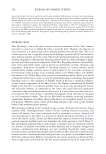
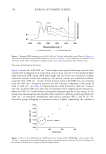
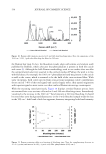
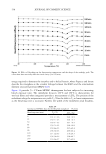
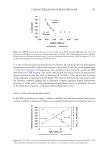
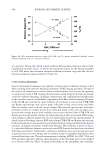
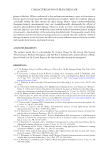
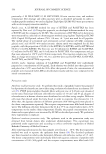
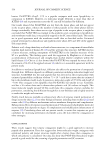
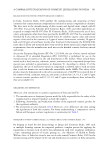
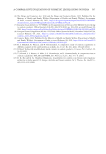
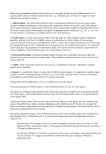
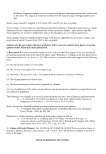
535 CHARACTERIZATION OF BLEACHED HAIR areas against the area of the phenylalanine band at 1003 cm−1 allowed for a quantitative probe of hair bleaching effects. Quantitatively, Figure 11 traces the content of the two essential indicators of the hair cortex structural integrity, namely the states of disulfide and cysteic acid plotted as a function of bleaching time. These indicators are visualized through the intensity (area) of vibrational bands for disulfide linkages (-S—S-) at 509–511 cm−1 and the cysteic acid band (-S—O- stretch) at approximately 1040 cm−1. The plotted intensity response of these bands is elegantly complimentary, displaying the disulfide intensity loss due to cystine-bond scission, accompanied by the increase in intensity of the cysteic acid band at 1040 cm−1, which together corroborate oxidative bleaching damage. To verify the integrity of the band normalization, the ratio of the 509 cm−1 and 1040 cm−1 bands to the 1450 cm−1 band were also calculated, yielding equivalent trends (17). The progression in intensity for the 509 cm−1 and 1040 cm−1 indicator bands conveys a distinct sigmoidal response to applied bleaching time. This change is particularly pronounced at shorter bleaching times, with an acceleration and apparent plateauing noted in the first hour. As mentioned in the infrared results, the nonlinear response segment between 15 and 60 min of bleaching may relate to the effects of bleach solution viscosity, sampling artifacts, or to the delayed swelling behavior of the fiber (i.e., due to increased alkalinity) in the early moments of the treatment. Agreement between Raman and FTIR bleaching kinetics is demonstrated by comparing the FTIR 1040 cm−1 cysteic acid band intensities, which are measurable with FTIR and Raman, to the 509 cm−1 -S—S- band intensity obtained exclusively from Raman scattering. Comparing the spectral markers in the virgin and 180-min bleached dark brown and natural white hair cross-sections, Figure 12A indicates that melanin granules and/or solubilized melanin remnants in dark brown hair negligibly influenced the height and area of the FTIR-ATR 1040 and 1080 cm−1 spectral EDF bands. In addition, Figure 12B compares the 1040/1080 cm−1 integrated band intensity ratio from FTIR imaging (using dark brown hair cross-sections) against the Raman 509/1003 cm−1 integrated shift ratio (using natural white hair cross-sections). The results for two completely different sets of experiments yielded a reasonably linear result (R2= 0.94), thus validating the ability to interweave EDF data from the Raman and FTIR techniques. Summarizing, equivalent damage factors were calculated from cortical and cuticular cysteic acid versus keratin band area normalizations. To contrast spectroscopic techniques and Figure 12. (A) Overlay of FTIR spectra for virgin European dark brown and natural white hair cross-sections bleached for 0 and 180 min. For each hair type, the spectra of virgin and bleached cross-sections are virtually identical and (B) comparison of EDF and EDF–1 evaluations from FTIR imaging and Raman scattering, respectively. EDB: European dark brown White: Natural white.
Purchased for the exclusive use of nofirst nolast (unknown)
From: SCC Media Library & Resource Center (library.scconline.org)