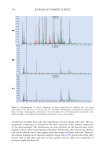
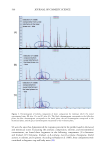
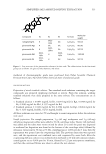
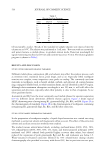
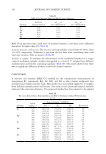
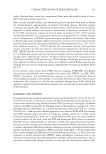
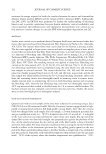
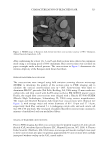
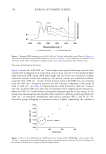
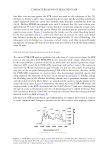
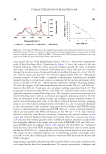
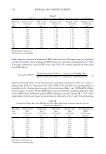
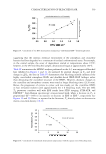
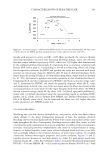
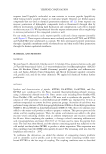
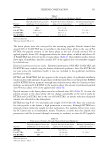
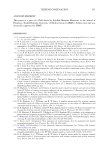
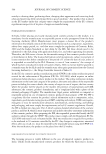
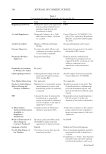
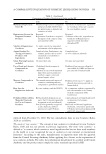
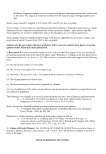
538 JOURNAL OF COSMETIC SCIENCE energy required to denature the interphase and α-helical keratin, where Popescu and Istrate describe the interphase as the covalent linkage between the IFKPs and the intermediate filament associated proteins (IFAPs) (8,13). Figure 14 provides β = 2°C/min HPDSC thermograms for hair subjected to increasing bleach exposure time. The endotherm between 120°C and 150°C is characteristic for wet hair fibers and when integrated provides a measurement of ΔH D . The position of the endotherm along the temperature axis yields T D . Note the shift in T D to lower temperatures as the bleaching time is increased. Further, the width of the endotherm peak broadens, Figure 14. Effect of bleaching on the denaturation temperature and the shape of the enthalpy peak. The curves have been vertically offset for visual clarity (β=2°C/min). Table IV Summary of HPDSC Data for the Bleached Samples (β=2°C/min) Bleaching time (min) TD (°C) ΔHD (J/g) 0 141.3 ± 0.6 19.8 ± 0.5 15 139.7 ± 0.3 19.8 ± 0.3 30 139.5 ± 0.3 19.7 ± 0.5 45 139.2 ± 0.5 19.8 ± 0.8 60 139.4 ± 0.3 19.5 ± 0.4 90 138.3 ± 0.3 18.9 ± 0.4 120 137.1 ± 0.3 17.6 ± 0.3 180 136.3 ± 0.4 15.8 ± 0.7 240 134.6 ± 0.7 10.7 ± 0.8

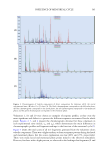
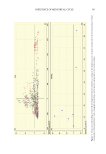
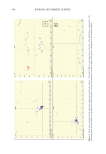
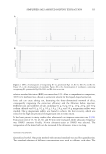
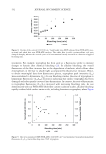
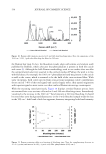
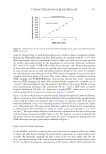
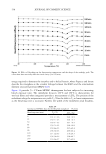
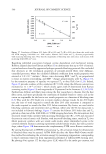
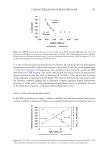
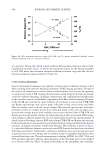
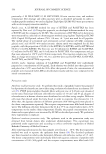
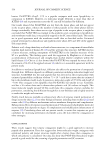
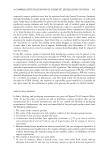
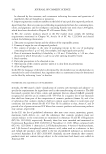
539 CHARACTERIZATION OF BLEACHED HAIR suggesting that the intrinsic chemical environment of the amorphous and crystalline keratins had been degraded to a continuum of residual conformational states. For example, in the control sample, the onset of degradation started at temperatures above 135°C however, in the 240 min bleached sample, denaturation began at approximately 120°C. Table IV summarizes the HPDSC analyses performed on the 2–3 mm snippets of bleached hair exhibited in Figures 2 and 14. As surmised by gradual changes in T D and little change in ΔH D , the data in Table IV demonstrate that bleaching initially influenced the highly cross-linked amorphous IFAPs and disulfide-based IFKP–IFAP linkages rather than denaturing the crystalline structure of the IFKPs. However, dramatic changes in the crystalline and amorphous contents were noted at longer bleaching times (≥120 min). Hence, the progression of cystine to cysteic acid was steady, yet the crystalline IFKPs in hair remained resilient until approximately the 2 h bleaching mark. The wet DSC T D parameter correlates well with EDF results from FTIR imaging, FTIR-ATR, and EDF/EDF−1 from Raman spectroscopy cross-sectional work, where a decrease in T D is proportional (R2=0.95) to an increase or decrease in EDF or EDF−1, respectively (see Figures 12 and 15). Hence, as reported in the literature, T D directly relates to decreases in matrix cross-link density (7,8,13). Figure 15. Correlation of wet DSC denaturation temperature with Raman EDF−1 (band height ratio). Figure 16. Correlation of normalized denaturation temperature with the square root of bleaching time.
Purchased for the exclusive use of nofirst nolast (unknown)
From: SCC Media Library & Resource Center (library.scconline.org)