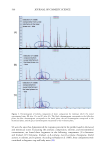
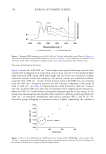
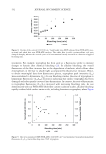
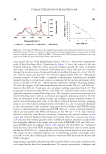
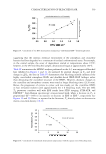
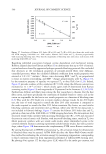
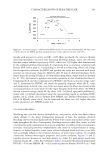
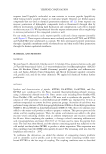
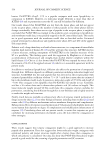
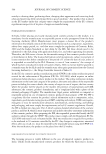
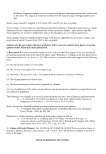
540 JOURNAL OF COSMETIC SCIENCE Regarding published associations between cystine degradation and mechanical testing, Robbins adapted data from Edman and Marti (5) to demonstrate that up to 45% of intrinsic cystine bonds are cleaved by aggressive hydrogen peroxide bleaching protocols. He concluded that decreases in the mechanical properties of peroxide-treated fibers were diffusion- controlled processes, where the calculated diffusion coefficient from tensile properties was assessed at 1.8 × 10⁻⁹ cm2min−1. Hence, since decreasing EDF−1 and T D are proportional to losses in matrix cross-linking, and EDF−1 changes proportionally with T D (Figure 15), by the transitive property of equality we expected T D to obey Fick’s law (1,24). Indeed, Figure 16 provides evidence of this correlation (R2=0.99), where the diffusion constant was estimated at 1.1 × 10⁻⁸ cm2min−1, which closely agrees with D determined from Raman scattering results (Figure 13) and magnitudes of D presented in the literature (1,3,24,25,26). Furthermore, Edman and Marti were among the first researchers to theorize that the hair fiber cortex, and more specifically, the conversion of disulfide bonds to cysteic acid in the cortex are responsible for the loss in wet tensile properties as a function of bleaching time (1,5). They used the 20% Index test to report oxidative damage results. In the 20% Index test, the ratio of work required to stretch the fiber 20% after treatment is compared to the work required to stretch the fiber 20% before treatment. By chance, we used similar bleaching conditions and treatment times as Edman, where only the 90 min data point is not included in Edman’s findings. Figure 17 contains the Edman 20% Index data and T D plotted as a function of the 1040/1080 cm−1 FTIR imaging band ratio. The data indicate that decreased tensile work correlates with increasing bleaching time (R2=0.95) and associated decreases in cortical cysteic acid. Further, with increased bleaching times, trends in T D (wet fibers) positively correlate with wet tensile work results, where diminished cystine is the common element. Raman scattering experiments yielded similar results, but with a positive slope, where Figure 12B demonstrates the complementary FTIR versus Raman correlation. By varying heating rates in HPDSC and assessing T D , the activation energy for denaturation of bleached fibers may be assessed. ASTM E698 describes the Flynn–Wall–Ozawa model- free method for evaluating the activation energy by measuring temperatures corresponding to fixed conversion values (α) from experiments performed at different DSC heating rates. By plotting ln(α) against 1/T, the slope gives -E a /R, where R is the molar gas constant, and Figure 17. Correlation of Edman 20% Index (R2=0.95) and TD (R2=0.99) data (from this work) with the FTIR imaging 1040/1080 cm−1 EDF results. Edman’s 20% Index and TD decrease proportionally with increasing bleaching time. Note that the magnitudes of bleaching time and cysteic acid increase with increasing 1040/1080 cm−1 ratio.

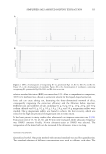
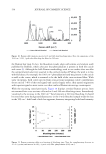
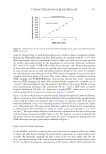
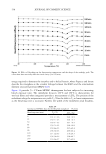
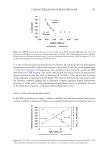
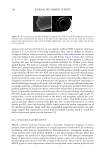
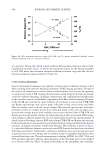
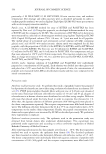
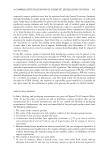
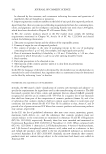
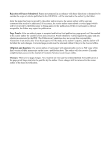
541 CHARACTERIZATION OF BLEACHED HAIR E a is the activation energy for denaturation of α-keratin. By assuming that the denaturation mechanism is invariable at different heating rates, the peak in T D may be used to approximate α = 0.5 (8,27,28). Figure 18 demonstrates the correlation of the assessed E a against the EDF determined by FTIR imaging. The results indicate that the energy barrier for denaturation decayed linearly for the first hour of bleaching (R2=0.99) — after which, the activation energy plateaued at approximately 180 kJ/mol. The range of determined E a values agrees with the literature however, perhaps due to inherently complex multistep keratin denaturation processes, or to the source of our virgin European dark brown tresses, we observed a decrease in E a , rather than an increase, with increased bleaching times (13,14). DRY DSC OF BLEACHED HAIR FIBER SNIPPETS In dry DSC experiments, no water is added to the DSC pans and denaturation and pyrolysis events are difficult to distinguish. Hence, we accepted that denaturation and pyrolysis were not Figure 18. HPDSC Ozawa denaturation activation energy versus FTIR imaging EDF band area ratio. The Ea plateau at 180 kJ/mol is associated with bleaching times ≥120 min. The standard deviation is ± 13 kJ/mol. Results from the Kissinger method (using TD) are overlaid with results from the OFW Ea analysis (27). The thermal measurements were performed in distilled water. Figure 19. Dry DSC critical matrix mobility and denaturation/pyrolysis enthalpy versus Raman EDF−1. The critical mobility temperature was assessed by the peak in Cp as a function of increasing temperature.
Purchased for the exclusive use of nofirst nolast (unknown)
From: SCC Media Library & Resource Center (library.scconline.org)