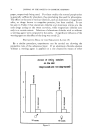
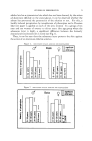
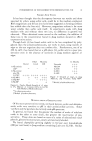
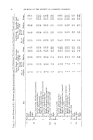
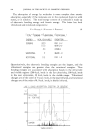
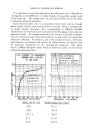
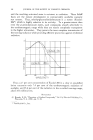
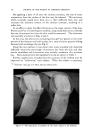
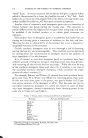
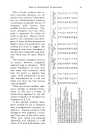
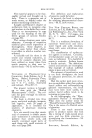
HUMAN SKIN SURFACE LIPIDS midpoint in a numerical series--is not affected by exceptionally high or low values. As is apparent from Graph I,t as well as from Table 1 the medians of the acid number for symmetrical sites are virtually identical. The wide ranges tabulated for each of the test areas are due to the fact that for any given site the values differed considerably among the subjects. The values are, moreover, by no means equal for our different test areas. The lipids from the three sites of the forehead, for example, have a lower acid number than those collected from mid upper chest, forearms or soles. For the soles the values are higher than for any of the other areas tested. Furthermore, a tendency is apparent for the values of some of' the areas to rise during the summer season. Only for the mid upper back an appreciable trend in the opposite direction seems to be apparent, but to date the number of subjects and assays is smaller for this site than for any other. t The Graphs I and II and the results presented in Tables 1 and 2 were submitted for pub- lication also to the Editors of "Der Hautarzt." GRAPH REGIONAL DISTRIBUTION AND SEASONAL VARIATION OF SPREADING INDEX cm2/mcgm (MEDIAN VALUES) 2.4 2.0 1..4 • •• 1.9 2.3 2.6 2 2 * * * ') 2.2 2 8 UPPER •IGURES: M•di•s of $pr•din• Index for LE•: Medians for - •pril T•mp.
Nor.
LOWER (o•) _ Median: 41 R•n•: 4 - 74 RIGHT: Medians 2.93'44.0 for May - •t.
LOWER Temp. (øF) - Median: 69 Range: 33 - 90

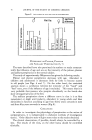
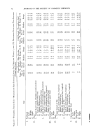
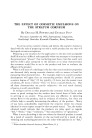
94 JOURNAL OF THE SOCIETY OF COSMETIC CHEMISTS The median values for the spreading index, while being practically equal for symmetrical sites, again differ distinctly for different skin regions. We have high values far mid upper chest, the calf regions and the soles and low values for temples and lateral aspects of the lower trunk. Again, a number of the medians are higher in the warmer season. This is even more pronounced than it was for the acid number. Thus, the difference between the means for the two seasons is statistically significant, or almost significant for forearms and calves (probability ranging from 0.05 to 0.1). COMMENTS The fact that the acid number is not the same for every area of the body surface must be borne in mind for any comparative evaluation especially as regards results obtained by different investigators. The fact that acid number and spreading index do not show a perfect correlation denotes a participation of components other than the free fatty acids in affecting the lipid spread. Free cholesterol, for example, is known to increase the index unsaturated fatty acids promote the spreading more than saturated acids, whereas waxes producing multilayers rather than a monolayer interfere with the spread. Like ourselves, Wheatley and his group discarded the spreading method as unreliable for estimation of the lipid amount and pointed out that the hydrocarbons in sebum do not spread in the surface film (14). We should like to know the cause of the differences, in particular in the acid number, obtained for the different skin areas. Like others, we believe that the presence of free fatty acids on the skin is largely due to esterase activity produced by the microbial flora, even though experi- ments presently in progress in our laboratory seem to suggest a liberation of acids also by other factors, such as enzymes preformed in the tissues. Microbial acitivity, nevertheless, can be regarded as crucial (15, 16). Microbial growth and activity usually being facilitated by moisture and impaired by dryness (17, 18, 19, 20, 21), liberation of fatty acids may be expected to be promoted in areas of increased sweating and/or under conditions of generally increased sweat delivery. Larger amounts of sweat, moreover, might render the triglycerides more susceptible to the attack by enzymes, since the lipids undergo spontaneous emulsification with the sweat, as was shown in our previous investigations (3, 4, 5). All this may well account for the higher acid numbers we obtained for such areas as the mid upper chest or the soles. Similar considerations would be justified regarding the increase of the values we observed for some of the test areas during the warm season. The seasonal differences should be the more distinct, the greater the contrast is for a given region between dryness in winter and moisture in summer. This would explain such differences as seen here for the forearms and soles (Graph II).
Purchased for the exclusive use of nofirst nolast (unknown)
From: SCC Media Library & Resource Center (library.scconline.org)