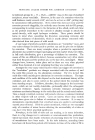
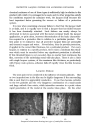
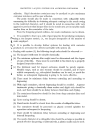
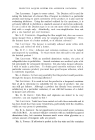
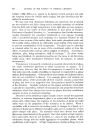
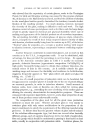
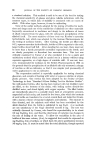
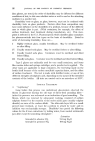
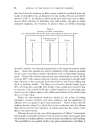
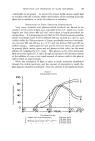
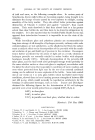
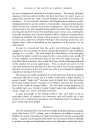
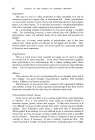
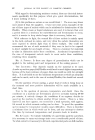
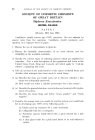
•8 JOURNAL OF THE SOCIETY OF COSMETIC CHEMISTS IOO Figure 2 Transmission Curves 7 80 I 40 • 20 I I O3oo 350 400 700 k u.v. Vra- Wavelength in mM 5. "Actinic green" bottles (Cr) 2.10 mm thick B. 3.25 mm thick 7. BI•} bottle"(Co) " 3.B5 mm thick 8. ,, •.80 mm thick •. Colourless medicine bottle •.57 mm thick the glass takes on a greyish hue. When the absorption is significantly greater for light of any colour, the transmitted light will appear of a complementary colour since the absorption is never sharp, the colour will depend on the thickness of the sample. Comparisons are best made by means of curves showing the change of absorption or transmission with wavelength for samples of standard thickness. _Figures I and oe, which show transmission curves for some commercial glasses measured at the Department of Glass Technology, Sheffield Univer- sity, unfortunately do not comply with this qualification, but give a good indication of the results obtained in practice. Fig. oe shows that the cobalt blue glass tested did not absorb much more U.V. light than the ordinary white bottle glass, having a transmission of over 80% at 400 m/•. Trans- mission was low in the visual range but quite high again in the infra-red. The special chromium yellow-green glass ("actinic green") on the other hand, gave a sharp cut-off above 400 m/•, with decreased transmission in the visible and infra-red. Fig. 1 well illustrates the effect of thickness of speci- men, and shows that the ordinary medium green glass (with colour due to iron content) and iron-manganese amber glass, offer a compromise. Both absorb quite well in the U.V. region, the amber better than the green, whereas

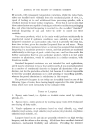
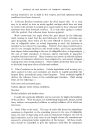
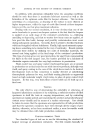
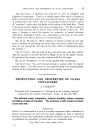
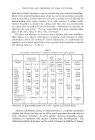
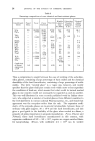
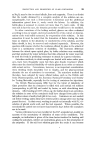
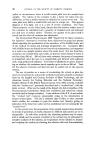
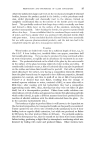
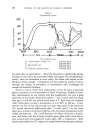
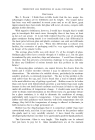
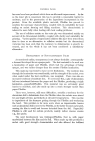
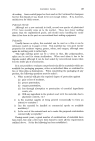
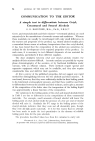
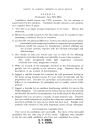
PRODUCTION AND PROPERTIES OF GLASS CONTAINERS 39 the positions are reversed in the infra-red, where the transmission of amber ,glass is, in fact, quite high. Both transmit reasonably well in the visible regior, i.e., are more transparent to the naked eye than the blue or actinic green glasses, and thus allow at least some measure of inspection of the container contents. This difficulty of inspection is a very real one, and provides a tendency against the use of coloured glass for injection solutions. In order to facilitate comparison of the absorbing powers per unit thickness {1 ram) of the glasses, the percentage transmission of which are shown in Figs. 1 and 2, extinction coefficients (K) were calculated and plotted. against wavelength in Fig. 8. This coefficient relates percentage transmission with specimen thickness and reflection loss from one surface, and a high value at ,any wavelength indicates high absorption or low transmission. Thus, the actinic green and amber glasses have high values for K at 400 m•, whilst for blue the value is practially zero. Although the question of the protection of light sensitive preparations is such an important one, its application still involves a considerable amount Figure $ Extinction Curves 4 Wavelength in m• 1. Amber vial (Fe--Mn) 2. Blue Bottle (Co) 3. Medium green bottle (Fe++--Fe +++) 4. Actinic green bottle (Cr) 400 600 800 I000 L, VISUAL ,i, NEAR r, • INFRA RED •
Purchased for the exclusive use of nofirst nolast (unknown)
From: SCC Media Library & Resource Center (library.scconline.org)