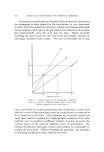
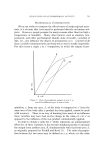
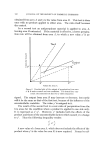
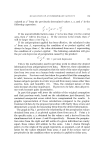
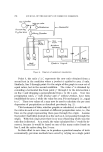
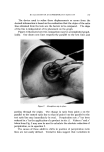
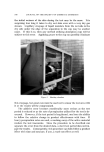
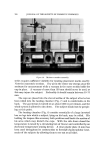
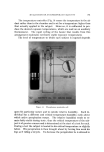
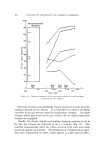
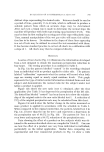
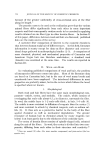
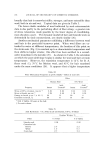
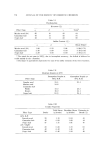
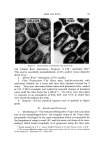
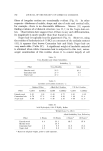
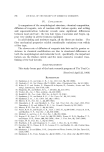
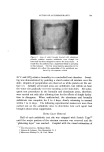
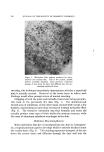
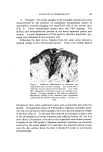
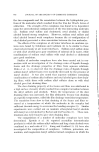
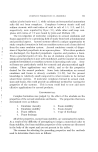
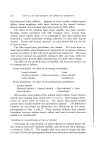
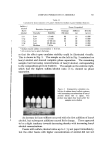
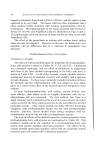
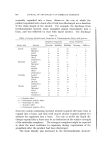
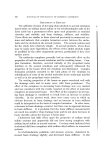
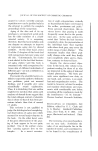
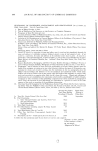
764 JOURNAL OF THE SOCIETY OF COSMETIC CHEMISTS 100 90 80 70 6O 5O 4O $0 20 lO Aver=ge Perspir=tion Depressions -A -B -C -D -E Prod. APlPl. C D o I hr. 4 hrs. Test Test Prod. Prod. Prod. I Appl. Ap•31. Appl. I 2 hrs. 3 hrs. Test Test Time, hours Figure 14. Graphic comparison of the test results obtained for five products, each tested on five subjects This type of sensor was specifically chosen because it records all of the moisture present in the stream. It is insensitive to relative humidity variables in the gas stream caused by temperature changes. The slight changes which may occur in the gas velocity due to small temperature changes are negligible. Finally, the electric signals representing changing moisture levels in the two gas streams are delivered to an x-y recorder (Fig. 12). This machine automatically plots the values received from each area being measured against one another. The simultaneous variations in perspira- tion rates represented by these values appear as a line pattern with a

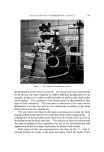
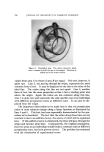
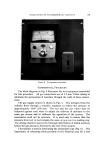
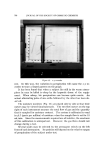
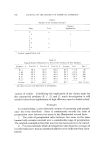
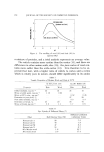
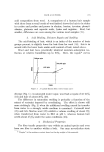
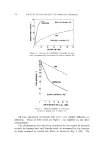
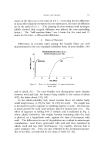
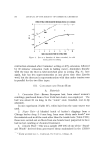
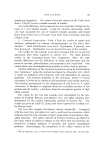
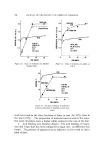
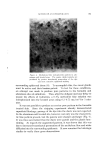
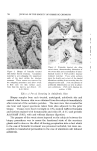
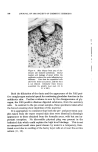
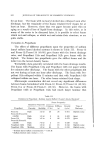
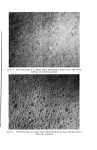
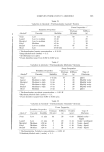
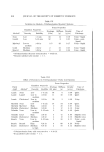
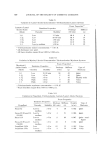
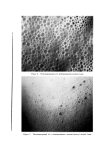
EVALUATION OF ANTIPERSPIRAXT ACTIVITY 76,5 distinct slope representing the desired ratio. Retraces should be run for a period of time, generally 15 to 30 min, which is sufficient to produce a suitable pattern from which an accurate slope may be determined. After each test a blank run is made to determine the normal slope the machine will produce with both cups sensing equal moisture levels. This may be done by first sealing the sensing part of the cups with plastic caps. Then, manual manipulation of the wet gas valve will cause this calibra- tion line to be drawn. Deviations in the slopes of these lines appearing in a set of tests may be utilized to correct the test associated with them. It has become standard practice to correct all charts to a calibration with a slope of 1. All charts may then be compared directly. RESULTS A series of four charts (Fig. 13) illustrates the information developed from a test designed to obtain the maximum perspiration reduction in four hours. The testing procedure is as outlined in Table I. In Fig. 13a the pattern labelled "control" is the recording obtained from an individual with no product applied to either side. The pattern labeled "calibration" represents what the system will record when both cups are sensing equal or nearly equal moisture levels. This graph represents the type of initial control information obtained from each test subject and demonstrates the normal ratio for the subject under test before a product is applied. Figure lSb shows the new ratio (test 1) obtained, after the first application (See Table I) has depressed the perspiration of the left side. The dotted line lobeled "control" has been drawn in to show the relation- ship of the original ratio to the new ratio labeled test 1. A reduction of 76% of the original perspiration rate may be calculated from this chart. Figures 13c and d show the further change in the ratios measured as more product is applied in accordance with the schedule in Table I. When compared to the original control line, the pattern, labeled test 2 in Fig. 13c, is lower than the one for test 1 and represents a depression in the perspiration rate of 96.6% in Fig. 13d. The pattern for Test 3 is even lower and represent a 98.$% reduction of the perspiration rate. Data showing the effect of a product on five subjects which was ob- tained in the manner described above are compiled in Table II. One can see how the effect of a product can vary from individual to individual, particularly on the initial application. Similar data comparing one experimental and four commercial products in Fig. 14 show a wide
Purchased for the exclusive use of nofirst nolast (unknown)
From: SCC Media Library & Resource Center (library.scconline.org)