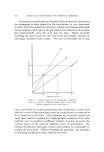
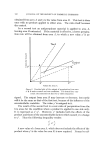
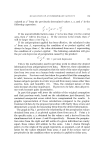
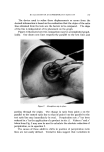
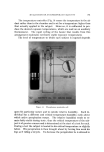
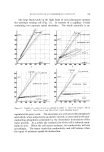
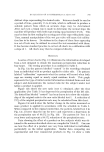
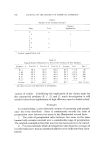
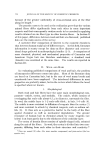
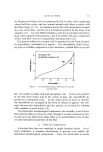
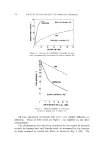
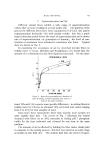
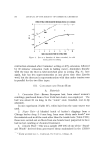
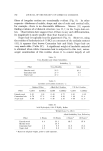
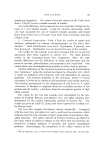
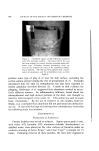
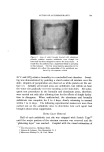
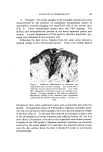
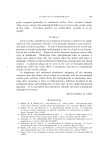
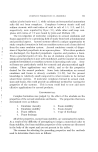
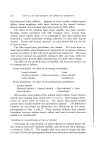
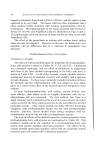
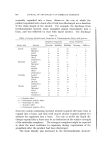
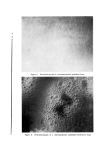
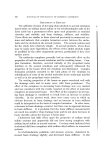
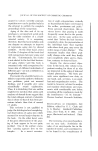
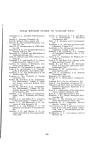
756 JOURNAL OF THE SOCIETY OF COSMETIC CHEMISTS Figure 6. Absorption cup. The outer concentric space uses a vacuum to hold the cup to the subject. Moisture is picked up in the center section values from area A to those of area B are equal. This test, however, is quite rare. Line 5, not passing through the origin, represents the more common form of test. It may be displaced to one side or the other of the ideal line. The ratios along this line are not equal. Line 6, another form of test, has the same properties as line 5 but a starting point also above the origin. Again the ratios are not constant along this line. Line 7 is quite rare and represents the only specific case of an individual with different perspiration ratios at different rates. It can also be dis- placed from the origin. The important observation to be made here is that the perspiration ratios of most subjects change along a linear function as illustrated by lines 5 and 6. This fact has been repeatedly demonstrated by the pro- cedure to be described. The fact that the ratios along these lines are not constant is due to an additive factor, the source of which will be explained later. If this additive factor is eliminated, the lines will pass through the origin and become ideal lines. Consequently, the original assumption, that two areas on an individual would retain a constant ratio at different perspiration rates, has been proven correct. The problem has remained with the elimination of experimental errors.

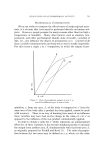
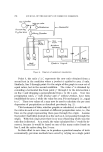
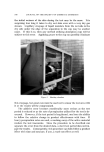
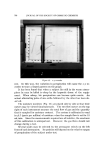
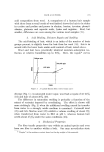
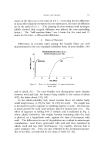
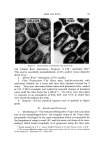
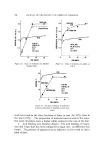
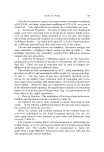
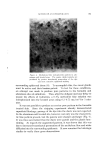
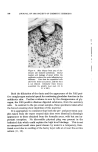
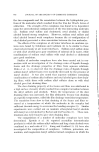
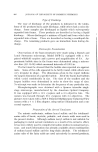
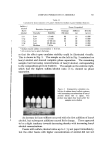
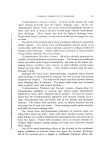
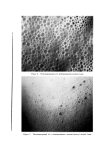
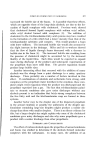
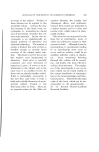
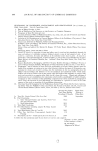
EVALUATION OF ANTIPERSPIRANT ACTIVITV 757 The device used to refine these displacements or errors from the desired information is based on the realization that the slopes of the ratio lines obtained from the tests are the factors to be compared. The slope of the line is independent of its placement on the graph. Figure 3 illustrates how this comparison may be accomplished graph- ically. One draws new lines respectively parallel to the test lines and Figure 7. Absorption cup in place passing through the origin. The change in ratio from point a on the parallel to the control ratio line to that of point b on the parallel to the test ratio line may immediately be read. Perspiration rate x" has been reduced to x' by the application of a product to site A. Values x" and x' taken from Fig. 3 may now be used to calculate the absolute reduction of perspiration, as in equation 2. The cm•ses of these additive shifts in position of perspiration ratio lines are not easily defined. Tentative data suggest that variations in
Purchased for the exclusive use of nofirst nolast (unknown)
From: SCC Media Library & Resource Center (library.scconline.org)