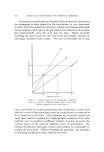
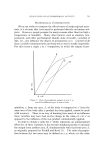
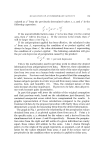
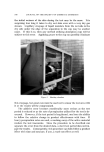
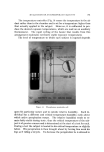
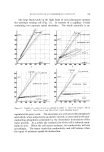
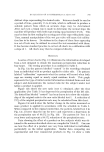
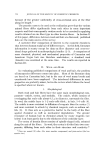
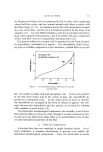
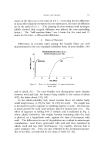
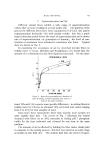
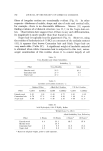
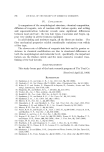
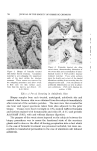
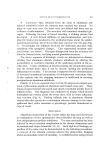
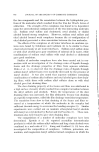
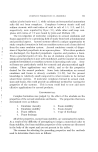
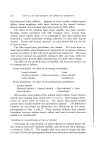
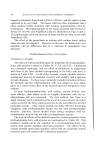
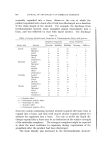
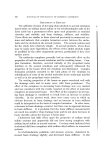
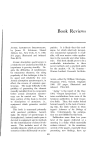
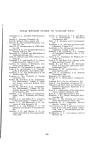
754 JOURNAL OF THE SOCIETY OF COSMETIC CHEMISTS G•s Cylinder O/ Wet 9•s valve X X • • 0 (-Højs•ur'zer J • Mixin 9 Chamber Ri9h% Lef[ Cup Cup He• Chc•mber H a. nomeber- Flow ois•ure Honi•or• o Left• ,.Side o F__lect:ric X-Y Recorder Figure 4. Diagram of equipment organization Point b, the ratio x'/y', represents the new ratio obtained from a second test in the condition where a product is applied to area A only. Similarly, line 2 through point b to the origin of the graph is a new set of equal ratios, but in the second condition. The value x" is obtained by extending a horizontal line from point y' through b to the intersection c on line 1 and dropping a perpendicular from c to the x-axis. Now two perspiration rates, x' with product and x" without product, have been established for area A while the value for area B is unchanged, i.e., equal to y'. These two values of x may now be used to calculate the per cent depression of perspiration as described previously (eq. 2). This treatment of data, whether graphic or calculated, is valid only if the ratios in each set are constant at different perspiration rates, i.e., the lines on the graph representing them pass through the origin. Assume that point b had fallen instead on a line such as 3, not passing through the origin. With this single point there is no way of knowing which way the ratio line is directed. As a result, the value calculated for x" would be in- correct, because it would be based on one of the many ratios found on line 3, and the ratios along line 3 vary. In their effort to save time, or to produce a practical number of tests economically, previous methods have erred by relying on a single point

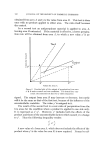
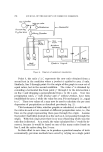
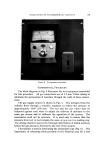
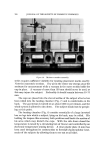
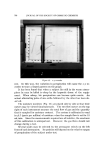
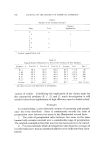
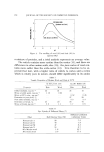
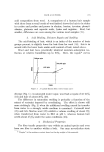
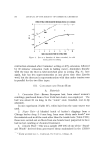
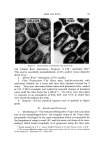
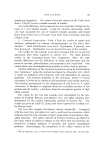
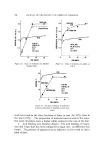
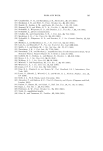
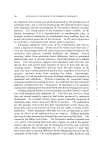
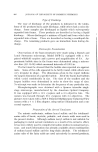
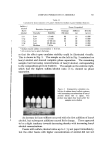
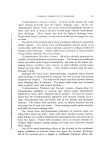
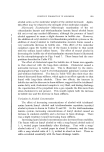
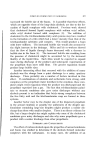
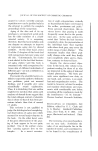
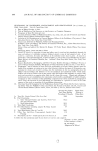
EVALUATION OF ANTIPERSPIRANT ACTIVITY Figure 5. Gas supply and regulating system determination of the ratios concerned. In a sense they have been forced to do this by the time required to collect sufficient perspiration for an accurate weight to be made or sufficient data to produce the single point by averaging. The constancy of the ratios cannot be determined by this type of data treatment. The ratio line or constancy of the ratio can be determined conveniently only by the continuous recording of the ratio itself rather than its components. The procedure described in this paper continuously records the ratio changes which result directly in a ratio line rather than a single point. A consequence of this precision is the discovery of several forms of error or deviations from the ideal ratio line. The analysis of these deviations and the understanding of their operation has led to the determination and application of the necessary corrections to obtain valid results. Four types of tests are represented by the lines in Fig. 2. Line 4, passing through tlze origin, is the ideal test along which the ratios of the
Purchased for the exclusive use of nofirst nolast (unknown)
From: SCC Media Library & Resource Center (library.scconline.org)