THE ROLE OF CONSUMER STUDIES IN RESEARCH 47 Also, • xi--• = • xi 2-- i•l i=l n The standard error of a difference between scores is the square root of the sum of the squares of the standard deviations of each score. / 1 S.E. of difference -• 4 nl n2 Assuming that the variances are the same, within the limits of random sampling:- 1 S.E. of difference = ( )i)( ) n 1 + n 2 2 For a percentage preference between two products, based on the assump- tion that if there is no difference between the products, each one has a 50% chance of being preferred, the standard deviation for percentage preference _75ø% x 50% n where n=number of panelists taking part in preference test. This is based on the binomial distribution where the standard deviation of a "proportion" distribution ---- .• pq n where p = probability of an event occurring q = , ....... not occurring = 1 - p and here, the probability of one product being preferred • 50%. However, for a net percentage preference, a 60% ! 40}/o split represents a 10% difference for each percentage from the null hypothesis but represents a 20% net preference. If each percentage is compared with 50%, the standard error in arriving at the net percentage preference is 2 X standard deviation of each separate preference percentage. Therefore, the standard error for net percentage preference

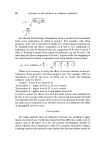
48 JOURNAL OF THE SOCIETY OF COSMETIC CHEMISTS •f5o% x 50% =2X n 100 In.a Round Robin design, information about a product can be obtained from every comparison in which it appears. For example, with three products, A, B, and C, the relative rating of C, when compared with B, can be obtained from the direct comparison of B and C, but additional in- formation can also be obtained from the comparison of B with A and of C with A. Working in terms of the ratios of preference, e.g. for B over C, the ratio from the direct comparison of B and C is given twice the weighting of the ratios from the indirect comparisons and the geometric mean is taken. e.g. best estimate of C - -- X • X • X •- 3 Where it is necessary to study the effect of several variables on the per- formances of one product a factorial design is best. For example, with two ingredients A and B, the levels of which can be varied, the following products could be tested. Control - A and B at a fixed level Test product 1 - higher level of A, B as in control Test product 2 - higher level of B, A as in control Test product 13 - higher level of A and higher level of B In order to assess the effects of A all four results can be used, similarly for B, (for A, the average of the scores for the control and test product 2 would be compared with the average of the scores for test products 2 and 13). Also, the data can be examined to see whether the level of A influences the effect of changing B and vice versa. CONCLUSIONS If t tables indicate that the difference between two products is signi- ficant at a level of say 1 in 20, this means that this difference could occur by chance once in 20 times. It is for the product development chemist to decide whether this is important to him. For a product intended to replace a leading brand on the market he may decide that the test product should be
Purchased for the exclusive use of nofirst nolast (unknown)
From: SCC Media Library & Resource Center (library.scconline.org)