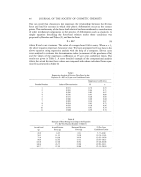
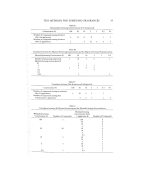
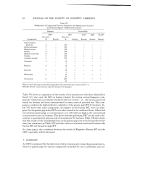
TEST METHODS FOR SCREENING FRAGRANCES Table II Minimal Skin Irritating Concentrations of 32 Compounds 59 Concentration % 100 30 10 3 1 0.3 0.1 Number of compounds causing irritation after one application 3 Number of compounds causing irritation after 21 applications 1 12 6 8 1 2 3 21 2 3 2 Table III Correlation between the Minimal Sensitizing Concentration and the Degree of Contact Hypersensitivity Minimal Sensitizing Concentration % 100 30 l0 3 1 0.3 Number of sensitizing compounds 1 10 5 5 1 Minimal eliciting concentration %: 10 1 3 4 3 1 1 1 3 2 1 0.3 3 0.1 0.03 2 1 Table IV Correlation between Skin Irritation and Allergenicity 7: Concentration % 100 30 10 3 1 0.3 0.1 .., Number of compounds causing sensitization after 21 applications Number of compound s causing skin irritation after 1 application 10 5 5 1 9 3 7 1 Table V Correlation between the Minimal Sensitizing and the Minimal Irritating Concentrations Minimal Sensitizing Concentration % Number of Compounds Minimal Irritating Concentration After 1 Application % Number of Compounds 100 30 10 3 0.3 1 10 5 5 1 100 30 10 3 30 10 3 0.1 30 10 3 30 10 3 0.3

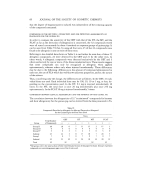
60 JOURNAL OF THE SOCIETY OF COSMETIC CHEMISTS that the degree of hypersensitivity induced was independent of the irritating capacity of the compound concerned. COMPARISON OF THE OET WITH 3 OTHER TESTS USED FOR DETECTING ALLERGENICITY OF FRAGRANCES FOR THE GUINEA PIG In order to compare the sensitivity of the GET with that of the DT, the MT, and the FCAT as far as the detection of allergenicity is concerned, the 32 compounds tested were all tested concurrently by these 4 methods on separate groups of guinea pigs. It can be seen from Table VI that, by using all four tests, 25 of the 32 compounds were found to be allergenic in one or more of these tests. Referring to the detailed data shown in Table I, it can further be seen that, of these 25 allergenic compounds, 22 were detected by the GET and 21 by the other tests. In other words, 4 allergenic compounds were detected exclusively by the GET and 3 others exclusively by one or more of the three intradermal tests. These results suggest that some compounds can only be recognized as allergenic when applied epicutaneously, whereas others only when injected intradermally. These differences may be due to the following: differences in the amount of compound administered in each test the use of FCA which has well-known adjuvant properties, and/or the nature of the solvent. Thus, considering only the dosage, the differences are as follows. In the GET, 21 indi- vidual doses are used. Each individual dose may be 100, 30, 10 or 3 mg, or less, de- pending on the concentration used. In the DT, 0.1 mg is injected intradermally 10 times. In the MT, the total dose is once 20 mg intradermally plus once 250 mg epicutaneously. In the FCAT 50 mg is injected intradermally 5 times. COMPARISON BETWEEN CLINICAL ALLERGENICITY AND THE FINDINGS ON THE GUINEA PIG The correlation between the allergenicity of 32 "incriminated" compounds for humans and their allergenicity for the guinea pig can be derived from the data presented in Ta- Table VI Compounds Described as Allergenic for Man and Detected as Allergenic a for the Guinea Pig by the Four Tests Used Group Tests GET DT MT FCAT Total Number of Compounds ..+ - + - + - + - Group II 18 18 0 7 11 15 3 17 Group III 4 4 0 0 4 0 4 0 4 Group IV 3 0 3 1 2 3 0 3 0 Subtotal 25 22 3 8 17 18 7 20 5 Group I 7 0 7 0 7 0 7 0 7 Subtotal 32 22 10 8 24 18 14 20 12 Total 32 32 32 32 32 •The group code is the same as that in Table I (see Results Section of this paper for data). Group I represents compounds not sensitizing guinea pigs in any of the 4 tests used.
Purchased for the exclusive use of nofirst nolast (unknown)
From: SCC Media Library & Resource Center (library.scconline.org)