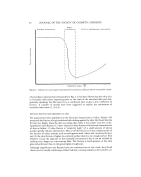
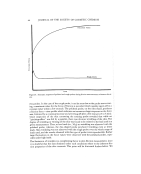
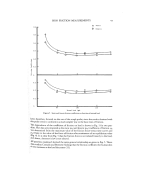
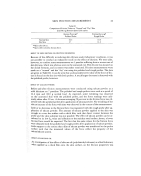
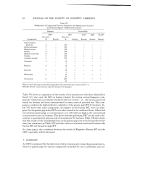
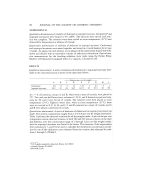
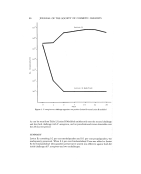
SKIN FRICTION MEASUREMENTS 45 0.6 0.5 0.4 0.3 0.2 o.z 0 0.3 0.2 0.1 Static Kinetic I , I I I I , I 50 100 150 Normal Load (gin) Figure 5. Static and kinetic friction coefficients as function of normal load '= have, therefore, focused on the use of the rough probe, since the results obtained with this probe seem to conform in a much simpler way to the basic laws of friction. :' The dependence of the coefficient of friction on load is shown in Fig. 5 for two pan- elists. The data are presented as the static (/as) and kinetic (/xu) coefficient of friction./as was determined from the maximum value of the friction force versus time curves and •k relates to the value of the force of friction after attainment of an equilibrium value (Fig. 4). It is clear from Fig. 5 that the friction force is not related linearly to the load, ß .: and, hence, Amonton's law is not obeyed. All panelists examined showed the same general relationship as given in Fig. 5. These data confirm Comafish and Bottoms' findings that the friction coefficient for human skin ::: •11 in vivo increases as the load decreases (13).

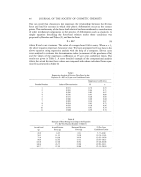
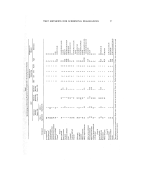
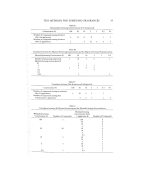
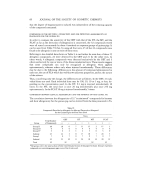
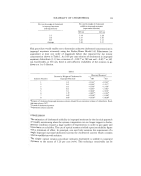
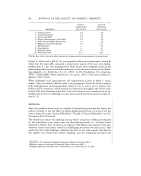
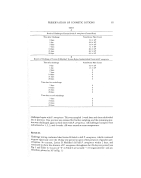
46 JOURNAL OF THE SOCIETY OF COSMETIC CHEMISTS One can recall that Amonton's law expresses the relationship between the friction force and load for systems in which only plastic deformation occurs at the contact points. The nonlinearity of the force-load relation has been attributed to contributions of other mechanical components in the process of deformation such as elasticity. A simple equation describing the force-load relation under these conditions was proposed by Bowden and Tabor (2), and has the form •F = K.L n (6) where K and n are constants. The value of n ranges from 0.66 to unity. When n = 1, the above equation expresses Amonton's law. We have attempted to fit our data to the above equation using regression analysis with the help of a computer. Eleven cases were analyzed to evaluate the determination index (a measure of the goodness of fit) and the values of the regression coefficients at 95 per cent confidence limits. The . results are given in Table I. A more detailed example of the computational analysis where the actual friction force values are compared with values calculated from equa- tion (6) is presented in Table II. Table I Regression Analysis of Friction Data Fitted to the Equation F = KL n at 95 per cent Confidence Limit Panelist Number Regression Coefficients Index of Determination K n 1 2 3 4 5 6 7 8 9 10 11 0.971 0.981 0.996 0.950 0.975 0.986 0.985 0.994 0.959 0.979 0.988 0.70 0.79 0.66 0.71 0.82 0.67 0.45 0.80 0.28 0.90 O.68 O.68 0.36 0.87 0.43 O.75 0.18 O.96 0.41 O.79 0.59 0.76 • Table II Example of Data Fitting According to the Equation F = KL n For Panelist Number 3 (Table I) Actual Load Actual Friction Estimated Friction 95 Per Cent (g) Force (g) Force (g) Confidence Limits 20.9 6.25 6.21 50.5 11.25 11.18 71.4 14.38 14.10 98.9 16.56 17.52 119.8 19.38 19.92 149.4 23.75 23.08 187.7 27.50 26.88 5.77-6.68 10.74-11.65 13.63-14.58 16.93-18.13 19.18-20.68 22.09-24.11 25.53-28.30
Purchased for the exclusive use of nofirst nolast (unknown)
From: SCC Media Library & Resource Center (library.scconline.org)