POLYMER-SURFACTANT INTERACTIONS 215 amount of solid in the polymer solution was 23.7% and was taken as the weight of the polymer. The % solid was determined by drying the sample at 130øC until constant weight was achieved. PROCEDURES The polymer/surfactant solutions for the solubility diagram were made as follows: SDS solutions were prepared with distilled water previously deaerated under vacuum and purged with nitrogen gas. The solutions were left standing overnight, capped under nitrogen. The pH of each solution was measured before appropriate weights of the polymer were added to them. The mixtures were again sealed under nitrogen and shaken vigorously. The polymer/surfactant solutions were allowed to equilibrate for nine days, after which the pH and the percent transmission were measured. To check for further change, the percent transmissions were measured again after allowing the solutions to stand for another 16 days and an additional 18 days, at which time no further change was detected. The solutions were then characterized according to their percent transmissions measured at 520 nm: clear (C) 100-96 slightly hazy (SH) 95-90 hazy (H) 89-85 very hazy (VH) 84-80 slightly turbid (ST) 79-75 turbid (T) 74-35 and very turbid (VT) 34-0. A Brinkmann PC/600 colorimeter was em- ployed for this purpose. The pH measurements were taken with an Orion Research Digital Ioanalyzer/501. In most cases, the pH reached a steady value rapidly. However, in some cases in which the SDS concentrations were low (•0.05%), and/or when the polymer concentrations were low (•0.01%), up to ten minutes were necessary for the pH to reach a steady range. The observed small oscillations may be attributed to surface adsorption/desorption phe- nomena of surface-active species at low concentration (9). Stock solutions of the polymer and SDS for surface tension measurements were prepared at pH 2.5, 9.5, and ! !. 5 in HCI or NaOH. Mixtures of the polymer and SDS were prepared from the stock solution. Thorough mixing was achieved through the use of magnetic stirring. For surface tension measurements, a Rosano Tensiometer equipped with a sand-blasted platinum blade was used. The surface of the solution was first cleaned by vacuum suction. The surface tension was then measured periodically until no further change between two consecutive measurements was obtained. Viscosity measurements were carried out with an Oswalt viscometer at 24øC. Acid- ometric titration of the polymer was made employing a Brinkmann 636 Titroprocessor. To establish qualitatively the overall ionization characteristics, both dialyzed and un- dialyzed polymer samples were used for the titrations. RESULTS AND DISCUSSION In polymer/surfactant complexation, it is well established that three different forces are involved in the associations. In the case of nonionic polymers/ionic surfactants, polymer-surfactant interactions are driven mainly by their hydrophobicity (!0, !!) through the reduction of the hydrocarbon/water contact area of the polymer and surfac- tant hydrophobic segments. Another type of force that promotes complex association is

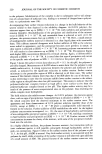
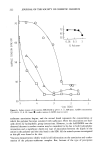
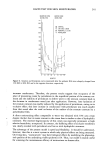
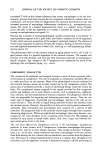
216 JOURNAL OF THE SOCIETY OF COSMETIC CHEMISTS 0.5 0.05 0.01 0.005 0.001 C ST,P T,P T,P T,P C,GP C C,P C,P H,P T,P T,P C,GP C C C VT, P VT, P C C C C C VT.,P SH C C C H c H,P C C C C C T SH C C C C C C C C C C ST,P C C CC 0.001 0.005 0.01 0.05 0.1 0.5 1 5 Keys %T C Clear 100-96 SH Slightly Hazy 95-90 H Hazy 89-85 VH Very Hazy 84-80 ST Slightly Turbit 79-75 T Turbit 74-35 VT Very Turbit 34-0 P Powdery Precipitate GP Gummy Precipitate PERCENT $DS Figure 2. Solubility diagram of Cartaretin F-23 with SDS in water. through dipole-ion interactions (4,12, 13). The third type is the strong coulombic or charge-charge interaction between oppositely charged species (14,15). In the present study, AADD is expected to interact with the anionic surfactant SDS through either hydrophobic group interaction or hydrophilic group interaction, or both, due to the nonionic/cationic nature of the polymer. Figure 2 represents the solu- bility diagram of mixtures of AADD (expressed in 100 percent activity) and SDS. In the lowest polymer region investigated, i.e., 0.001%, the systems remain clear with an increasing amount of SDS in the mixture. Nonclear mixtures appear when the polymer concentration is •0.005% and are dependent on the mixing ratio. In general, at low SDS concentrations, the mixtures stay clear. When the amount of SDS is increased, nonclear mixtures are observed. However, further addition of SDS returns the mixtures to their clear state. With all nonclear mixtures, a visible precipitate of solid material eventually appears at room temperature, except in the very dilute regions. Here, two distinct types of precipitates are observable: a redispersible, granular type (P) that ap- pears in most of the precipitated solids, and a nondispersible, gummy type (GP) that is observed at polymer concentrations •0.5% and at a mixing ratio in the region of 2:1 (w/w) polymer to SDS. Outside this range, the precipitates are more granular in nature. The pH variation of the mixtures as a function of SDS concentration, at a given polymer content, is shown in Figure 3. It is seen that a rise in the pH occurs in all cases. The onset of the pH rise is dependent on the polymer concentration: the higher the polymer
Purchased for the exclusive use of nofirst nolast (unknown)
From: SCC Media Library & Resource Center (library.scconline.org)