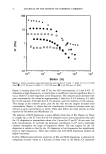
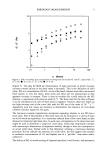
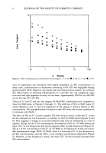
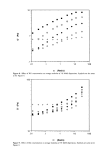
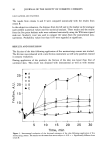
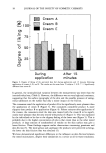
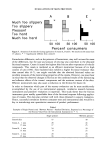
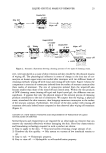
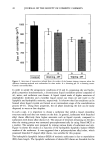
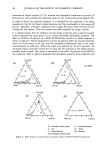
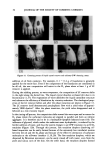
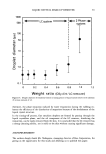
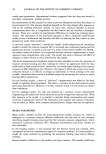
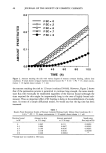
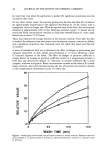
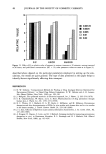
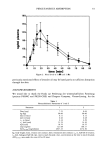
EVALUATION OF SKIN FRICTION 19 Much too slippery Too slippery Pleasant Too hard Much too hard A i3 E 50 100 50 100 50 100 Percenf consumers Figure 4. Sensation of the skin feel during application of creams A, B and E. The results are the mean from 15 subjects. • = Significantly different from cream B. Formulation differences, such as the presence of humectants, may well account for some of the differences, but the type and amount of oils may also contribute to the obtained frictional response. Cream A caused the highest skin friction after evaporation of volatile compounds. This cream is marketed as an efficient moisturizer because of its high content of urea (10%). Since hydrated skin exhibits a higher frictional resistance than does normal skin (4-7), one might conclude that the obtained frictional values are excellent measures of the moisturizing properties of the creams. However, one must bear in mind that the observed changes in friction are the combined results of the lubricating and adhesive effects of the creams' components and the moisture content of the skin. Efficient moisturizers may also cause a reduction in the friction for hours (4). In order to determine which part of the sensory evaluation can be most satisfactorily accomplished by the use of an instrumental approach, correlative research between instruments and panelists' evaluation is important. This study shows that the friction instrument gives readily quantifiable data of the frictional response following applica- tion of creams. The data also correlate well with those obtained in sensory evaluation. Hence, successful correlation between consumer tests and instrumental data would be a key to introducing new quantitative measures of product performance. Table I Examples of Single Person's and "Between Persons'" Standard Deviation, Expressed as a Percentage of the Friction Value From the Instrumental Assessment (n = 7) Single person's "Between persons'" Control skin 15 18 Cream A, 1 min 28 45 15 min 17 25 Cream B, 1 min 54 19 15 min 8 21 Cream E, 1 min 20 26 15 min 16 23

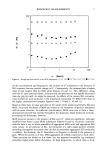
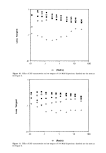
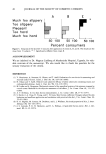
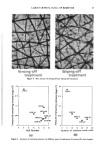
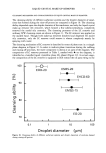
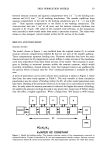
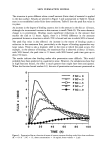
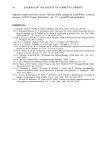
20 JOURNAL OF THE SOCIETY OF COSMETIC CHEMISTS Much too slippery Too slippery Pleosonf Too hord Much too hord A B E 100 50 100 50 100 Percent consumers Figure 5. Sensation of the skin feel 15 minutes after application of creams A, B, and E. The results are the mean from 15 subjects. * = Significantly different from cream B. ACKNOWLEDGMENT We are indebted to Dr. Magnus Lindberg of Akademiska Hospital, Uppsala, for valu- able criticism of the manuscript. We also would like to thank the panelists for the sensory evaluation of the creams. REFERENCES (1) V. Henricsson, A. Svensson, H. Olsson, and T. Ax•11, Evaluation of a new device for measuring oral mucosal surface friction. Scand. J. Dent. Res. 98, 529-536 (1990). (2) H. Olsson and T. Axdll, Objective and subjective efficacy of saliva substitutes containing mucin and carboxymethylcellulose. Scand. J. Dent. Res. 99, 316-319 (1991). (3) M. Loddn and A. Bengtsson, Mechanical removal of the superficial portion of the stratum corneum by a scrub cream: Methods for the objective assessment of the effects. J. Soc. Cosmet. Chem. 41, ! 11-12 ! (1990). (4) A. F. E1-Shimi, In vivo skin friction measurements. J. Soc. Cosmet. Chem. 28, 37-51 (1977). (5) S. Nacht, J.-A. Close, D. Yeung, and E. H. Gans, Skin friction coefficient: Changes induced by skin hydration and emollient application and correlation with perceived skin feel. J. Soc. Cosmet, Chem. 32, 55-65 (1981). (6) D. R. Highley, M. Coomey, M. DenBeste, and L. J. Wolfram, Frictional properties of skin. J. Invest. Dermatol, 69, 303-305 (1977). (7) J. S. Comaish, P. R. H. Harborow, and D. A. Holman, A hand-held friction meter. Brit. J. Der- matol. 89, 33-35 (1973).
Purchased for the exclusive use of nofirst nolast (unknown)
From: SCC Media Library & Resource Center (library.scconline.org)