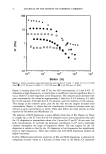
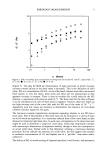
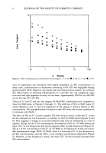
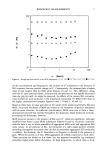
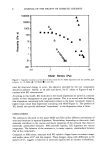
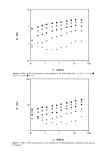
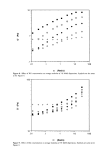
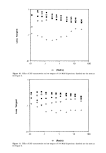
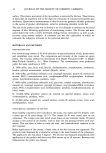
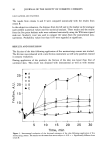
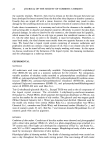
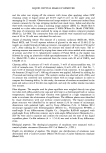
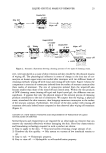
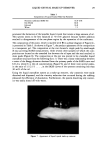
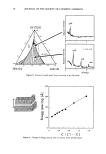
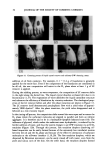
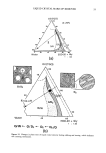
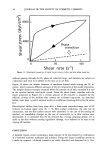
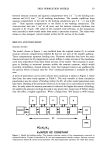
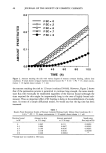
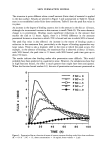
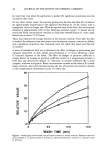
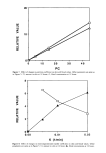
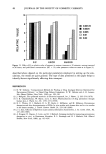
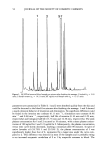
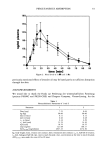
PERCUTANEOUS ABSORPTION 51 at -20øC until chromatographic and spectroscopic investigations. For statistics, each experiment was repeated three times on the same human subject. EXTRACTIONS The plasma was extracted by using a Bond-Elut-C18 column (100 mg, Analytichem Int. Comp., USA). After preconditioning with 3.0 ml methanol and 2.0 ml water bidest., the fragrances were eluted nearly quantitatively with 0.5 ml methanol (recovery rate: 88.2-93.1% standard deviation: +6.2% concentration range 1-150 ng/ml). GC-FID An HRGC-Mega-Series (Carlo Erba Comp.) and a 25-m HP-5 fused silica column (i.d. 0.32 mm film thickness: 0.17 •m) were used. Carrier gas: hydrogen split-ratio: 1:20 injector temperature: 250øC detector temperature (FID): 320øC temperature program: 60 to 300øC, rate of 6øC/min injected volume: 1 •1. GC-MS An HP-5890A gas chromatograph and an HP-5970B-Mass Selective Detector mass spectrometer (Hewlett-Packard Comp.) with data system HP-59970C-Chem-Station were used. Interface-heating: 300øC mass range: 40 to 450 amu 70 eV for electron impact carrier gas: helium. QUANTIFICATION GC-FID measurements with tiglinic acid benzyl ester (ST) as an internal standard (1 •g/ml methanol) were employed. CALCULATIONS Statistics were performed by an Atari 1040 personal computer (program "WISTAT"). Pharmacokinetic parameters were determined using an IBM AT 286 PC (program NONLIN). RESULTS AND DISCUSSION In the first step of this work the main constituents of lavender oil (linalool 1 and linalyl acetate 2) were quantified time dependently by GC-FID in the blood of the subject after the massage. As can be seen from Figure 1, 1 and 2 were well separated from the matrix peaks (t R 1 = 5.03 minutes tR 2 = 10.21 minutes), and there is no overlap with the internal standard (tu ST = 15.37). The plasma concentration versus time data were fitted to an open two-compartment standard pharmacokinetic model (for serum con- centration time curves for 1 and 2, see Figure 2 the corresponding pharmacokinetic

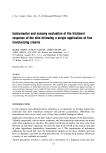
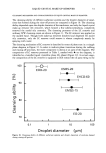
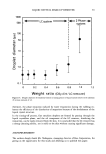
52 JOURNAL OF THE SOCIETY OF COSMETIC CHEMISTS I 2 ST Figure 1. GC-FID of extracted blood sample ten minutes after finishing the massage: 1 linalool (t u = 5.03 min) 2 linalyl acetate (t R = 10.21 min) ST tiglinic acid benzyl ester (tR = 15.37 min). parameters are summarized in Table I). 1 and 2 were absorbed quickly from the skin and could be detected in the blood five minutes after finishing the massage. 1 and 2 showed a nearly identical behavior of resorption and elimination. No significant difference could be found in the invasion rate constant (0.11 min-•), elimination rate constant (0.46 m,n and 0.48 min • respectively), half life of invasion (6.16 min and 6.29 min, respectively) and biological half life (13.76 min and 14.30 min, respectively). The peak plasma concentration for 1 and 2 occurred at 19 minutes, with a mean plasma concen- tration of 100 ng/ml for 1 and 121 ng/ml for 2. Subsequently, the plasma concentration versus time curve slowly decreased, reaching a minimum after 90 minutes. In spite of native lavender oil (24.79% 1 and 29.59% 2), the plasma concentration of 1 was significantly higher than that of 2, represented by a larger area under the curve com- pared to 2. This difference was detected in most of the samples and is probably owing to an increased enzymatic catabolism of 2 to 1 by unspecific esterases in blood. The
Purchased for the exclusive use of nofirst nolast (unknown)
From: SCC Media Library & Resource Center (library.scconline.org)