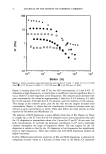
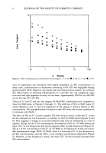
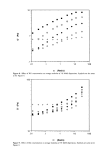
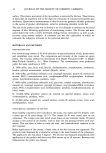
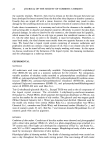
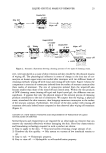
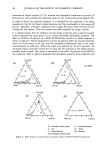
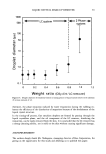
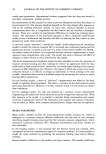
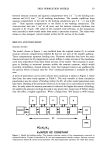
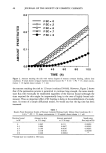
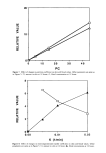
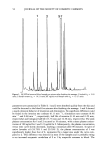
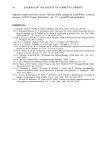
RHEOLOGIC MEASUREMENTS 3 ticity. G" is the loss modulus, referring to the loss of energy through viscous flow. The relationship among the moduli is given in Equation 2, G* = G' + i G" [2] in which i = %/-1. The loss tangent, a measure of the relative contributions of elasticity and viscous flow, is defined as G"/G'. Values of loss tangent below 1 indicate that elasticity dominates rheologic behavior. In this paper we describe rheologic measurements of MAS and XG and mixtures of the two using a dynamic technique. EXPERIMENTAL XG (Keltrol T ©, Kelco Division, Merck & Co., San Diego, CA), MAS (Veegum ©, R. T. Vanderbilt, Norwalk, CT), and methylparaben and propylparaben (both Fisher Scientific, Springfield, NJ) were used as received. Concentrated dispersions of XG and MAS in aleionized water containing 0.1% methylparaben and 0.03% propylparaben were prepared in a homomixer (30% scale). The mixing time for XG dispersions was 24 minutes that for MAS dispersions was 50 minutes. Dispersions of either a pure com- ponent or mixtures of XG and MAS were made by appropriate dilution with water containing the preservatives and agitation for five minutes at 1000 RPM using a small propeller mixer. The concentrations indicated are the final concentrations in the dis- persions. All were stored at room temperature for approximately 12 days prior to measurement. All comparisons were made on systems stored for exactly the same length of time. These mixing and storage times, though arbitrary, were chosen to ensure that the shear history of all MAS samples would be uniform so that reliable comparisons among various combinations with XG could be made. Rheologic data obtained with other preparation equipment and conditions might differ from those reported below, but we anticipate that the trends observed should be the same. The Bohlin VOR constant strain rheometer (Bohlin Rheologi, Cranbury, NJ) was used for most measurements of viscoelastic behavior. Studies at constant stress were per- formed using a Bohlin CS rheometer. Concentric cylinder measuring geometry (27.5- mm diameter cup, 25-mm bob) was utilized in all cases. All measurements were made at 25øC after equilibration for 15 minutes. RESULTS AND DISCUSSION The first step in measurement of viscoelasticity is performance of a "strain sweep" to evaluate the degree of strain that can be tolerated before the samples behave in a nonlinear fashion. Figure 1 contains data for two XG solutions, a 3% MAS dispersion, and combinations of 1% MAS with XG. The XG solutions can tolerate 50% strain without showing significant variation in the values of G', the storage modulus. The G' values for MAS are approximately constant over less than 10% strain. The linear range for combinations of MAS with XG falls between the values for the component materials. To ensure that all measurements were made within the linear range, gum solutions were subjected to a strain of 20%, and 4% was used for MAS dispersions and MAS-XG combinations.

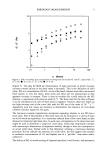
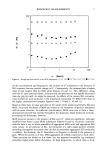
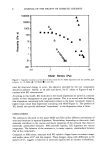
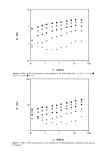
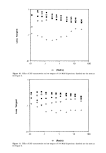
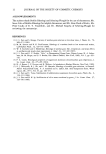
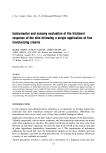
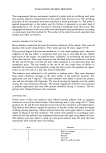
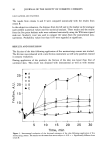
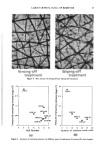
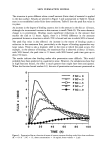
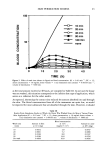
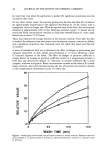
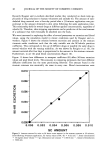
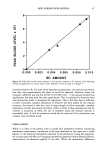
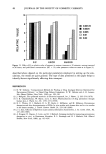
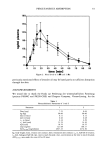
4 JOURNAL OF THE SOCIETY OF COSMETIC CHEMISTS lOO lO X XX X X X x ß O0 O0 O0 0 0 0 mmmmmmm o ß O• X XXx oo [] o o ß o .01 ........ , ........ , ........ , ........ 10 0 10 • 10 2 10 a 10 4 Strain (%) Figure 1. Linear viscoelastic region determined by strain sweep at 6.3 rad/s. x, MAS, 3%' [•, 0.1% XG alone I, 0.1% XG plus 1% MAS O, 0.4% XG alone O, 0.4% XG plus 1% MAS. Figure 2 contains plots of G' and G" for two XG concentrations, 0.2 and 0.4%. G' dominates at high frequencies, at which there is insufficient time for significant flow to occur, while G" is more important at low frequencies. The crossover point decreases with gum concentration the values are approximately 2 rad/s for a 0.1% solution, 0.3 rad/s for a 0.2% solution, 0.06 rad/s for a 0.3% solution, and 0.01 rad/s for a 0.4% solution. This change in the crossover point, plus the fact that the loss tangent decreases with concentration (Figure 3), shows that the contribution of elasticity becomes more sig- nificant as gum concentration is raised. These data follow the same pattern as those reported by Rochefort and Middleman (3). The behavior of MAS dispersions is quite different from that of XG (Figure 4). There is a slight dip in the G" curve for the 3% dispersion and a more pronounced dip with the 1% dispersion at intermediate values of to. Curves for G' and G" do not cross. For both concentrations, G' provides the dominant contribution to G* and is essentially constant throughout the range of frequencies shown. The loss tangent for the 3% dispersion is similar to that for the 1% dispersion at low frequencies but significantly lower at high frequencies. These data confirm that both MAS dispersions studied are highly structured. Further differentiation between properties of XG and MAS dispersions is obtained by comparing viscosity values as a function of shear stress in the Bohlin CS rheometer
Purchased for the exclusive use of nofirst nolast (unknown)
From: SCC Media Library & Resource Center (library.scconline.org)