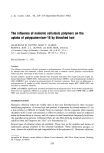
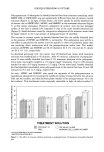
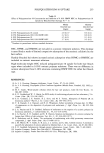
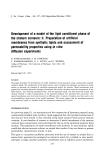
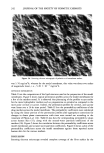
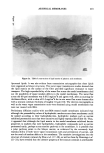
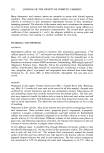
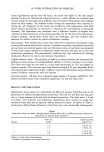
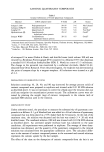
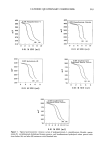
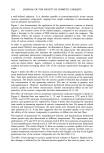
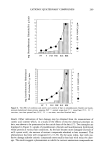
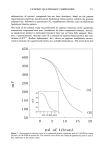
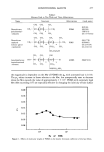
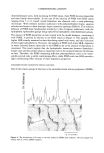
ARTIFICIAL MEMBRANES 241 of Ecolite scintillation cocktail and assayed for radioactivity with a Beckman LS 9000 counter. RESULTS ELECTRON MICROSCOPY Scanning electron microscopy revealed that the model membrane surface was completely covered with a lipid film, although the surface was fairly uneven. Typical micrographs are shown in Figures la and lb. Few lipid crystals could be observed. Figures 2a and 2b show typical transmission electron micrographs of cross-sections of the model mem- branes. Distinctive bilayer patterns are evident at higher magnifications (Figure 2b). The apparent defects seen as empty spaces extending across the sections at low magni- fications (Figure 2a) were found to be artifacts caused by the non-uniform expansion of the bilayers during the fixation process. WATER VAPOR TRANSMISSION STUDIES Figure 3 shows a plot of the cumulative weight loss as a function of time for the model membrane system and for an untreated filter. The water flux across the untreated filter Figure la. Scanning electron micrograph of 2-Ix pore size Nucleopore filter surface. .-

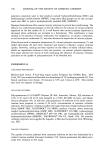
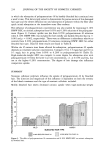
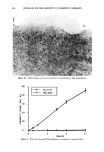
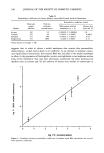
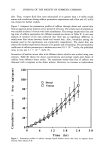
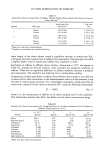
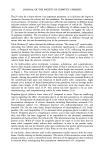
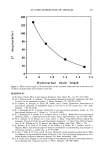
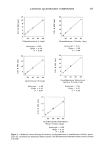
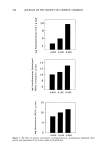
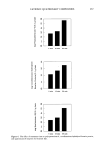
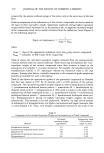
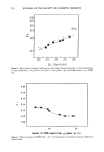
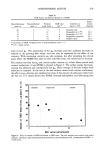
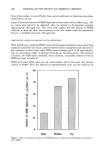
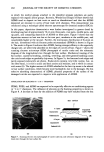
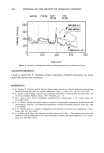
242 JOURNAL OF THE SOCIETY OF COSMETIC CHEMISTS , .:, --• % : x • - . ... . -. _ • . . :• • Figure lb. Scanning electron micrograph of palmitic acid membrane surface. was 5.76 mg/cm2h, whereas for the model membrane, this value was about two orders of magnitude lower, i.e., 5.20 x 10 -2 mg/cm2h. DIFFUSION EXPERIMENTS Table I lists the compositions of the lipid mixtures used in the preparation of the model membranes. Figure 4 shows typical permeation profiles across the model membranes for a few of the markers tested. It is observed that plateauing of the profiles occurs earlier for the more hydrophobic markers such as progesterone or estradiol as compared to the more polar cortisol or sucrose. Indeed, the permeation profiles for cortisol, and sucrose were linear over a 24-hr time period. Table II lists the permeability coefficients of the drug markers across the model membrane. The permeability coefficients were calculated by using the linear portion of the permeation profiles after appropriate corrections for changes in donor phase concentration with time were carried out according to the treatment of Flynn et al. (14). Table II also lists the corresponding permeability values across human skin (15), along with the octanol-water partition coefficients of the markers (16). Figure 5 shows the correlation between the permeability coefficients across model membranes and octanol-water partition coefficients. Figure 6 shows a plot of the permeability coefficients across the model membranes against those reported across human skin for the various markers. DISCUSSION Scanning electron microscopy revealed complete coverage of the filter surface by the
Purchased for the exclusive use of nofirst nolast (unknown)
From: SCC Media Library & Resource Center (library.scconline.org)