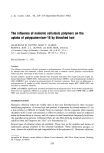
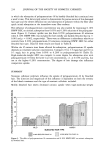
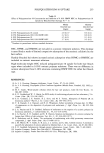
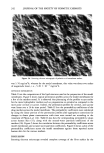
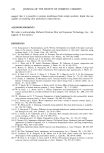
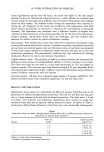
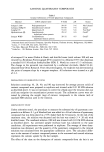
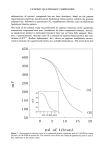
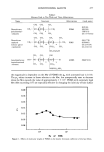
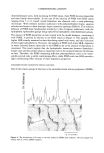
ARTIFICIAL MEMBRANES 243 Figure 2a. TEM of cross-section of lipid matrix of palmitic acid membrane. liposomal lipids. It was also evident from transmission micrographs that these lipids were organized as bilayer structures. The water vapor transmission studies showed that the lipid matrix on the surface of the filter provided significant resistance to water transport. The high reproducibility of the water flux across the model membranes ruled out the possibility of major random defects in the model membranes. The water flux across the 60 •m membrane was 0.052 mg/cm2h and agrees well, after accounting for thickness effects, with a value of 0.4 mg/cm2h for in vivo water flux across human skin with a stratum corneum thickness of roughly 10 •m (10). The electron micrographs as well as the water vapor transmission rates were obtained using model membranes that were not treated with BSA. Preliminary diffusion studies with non-BSA-treated model membranes indicated that although the permeability values of hydrophobic markers across these membranes could be ranked according to their hydrophobicities, hydrophilic markers such as sucrose exhibited permeation rates that were excessive and highly reproducible (Table II). Thus, it appeared that although the lipid matrix in the model membrane exhibited barrier properties to markers that were hydrophobic, hydrophilic compounds such as sucrose permeated easily, perhaps across another pathway in the membrane. It is possible that a polar pathway exists in the bilayer matrix, as evidenced by the extremely high reproducibility of both water vapor transmission rates and permeation of sucrose, and not the result of random defects in the membrane. The extensive investigations into the structure of stratum corneum by Elias et al. (17-20), as well as those by Downing et al. (21-23), have revealed that the cohesive property of the stratum corneum is attributable

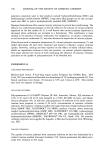
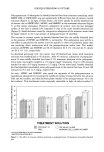
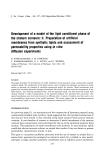
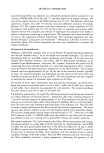
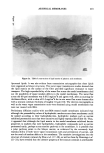
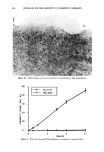
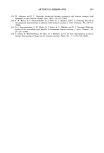
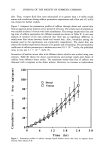
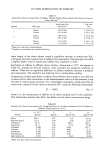
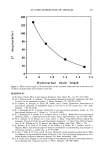
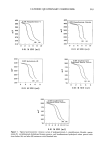
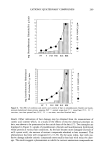
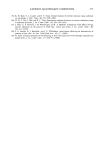
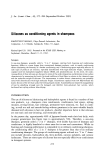
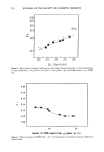
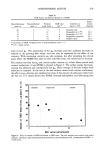
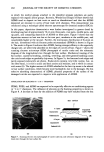
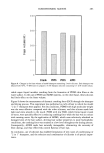
244 JOURNAL OF THE SOCIETY OF COSMETIC CHEMISTS Figure 2b. TEM of bilayer structures of palmitic acid membrane at high magnification. lOO • 80 - 60 40 • 20 PA-SLM's filter alone 0 4 8 time (h) Figure 3. Water loss through PLM membranes as compared to untreated filter 12
Purchased for the exclusive use of nofirst nolast (unknown)
From: SCC Media Library & Resource Center (library.scconline.org)