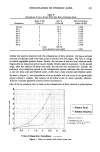
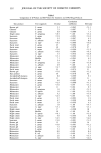
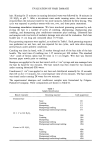
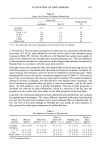
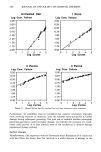
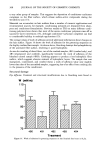
PRESERVATIVE EFFICACY TESTING 331 isms in "pooled" inocula. Pooled inocula consisted of saline suspensions prepared using organisms that had similar maximum acceptable D-values (i.e., P. aeruginosa and S. aureus E. coli and P. cepacia) and/or recovery media (i.e., C. albicans and A. niger). DETERMINATION OF D-VALUES D-values were calculated as described previously (4). Estimated D-values (ED-values) were calculated from the same data using APCs taken immediately after inoculation (i.e., at time = 0 hr) and at 24 hr for site-significant organisms (i.e., pathogens/ opportunistic pathogens) or 7 d for organisms that are not site-significant (i.e., non- pathogenic bacteria, yeasts, and molds). Thus, ED-values were equal to the negative reciprocal of the slope of a survivor curve constructed from APCs immediately after inoculation of test organisms into test samples and at 24 hr (for S. aureus, P. aeruginosa, or C. albicans) or 7 d (for E. coli, P. cepacia, Bacillus, and A. niger). D-values and ED-values, which were calculated using APCs of C tO/g, were expressed as "less than" a specific time (i.e., C3.5 hr). The "less than" signs were not used in determining mean APC values. STATISTICS Significant differences between D-values and ED-values were assessed by an independent t-test using Sigmaplot 4.0 (Menlo Park, CA). Linear regressions were determined using a hand-held calculator (4). RESULTS AND DISCUSSION Screening studies have been used in our laboratories for estimating D-values for several years however, ED-values obtained with the screening method have not been compared with D-values obtained by the linear regression method for cosmetic and OTC-drug products. D-values were determined using APCs at several times for each test organism. Direct comparison of D-values with ED-values was possible because both were calculated from the same experimental data: D-values were determined using 0, 2, 4, and 24 hr or 7 d APCs ED-values were determined using 0 and 24 hr or 7 d APCs. Table I compares 60 D-values and ED-values calculated using data obtained during preservative efficacy tests of cosmetics and OTC drugs including facial moisturizers, night creams, sunscreens, facial toners, shower gels, and antidandruff shampoos that were challenged with several different test organisms. The D-values ranged from CO. t hr (i.e., where the population of P. cepacia was not detected at the 2-hr reading, so that the D-value had to be estimated) to 39 hr. The ED-values ranged from C3.0 hr to 42 hr. The Student's t-test showed that the mean D-value (6.9 hr) and the mean ED-value (7.4 hr) were not significantly different (p 0. t0). When the D-values were C t0 hr, the differences in D-values and ED-values for the same experimental data ranged from 0 hr (where the values were the same) to 4.9 hr in a night cream (where the D-value was CO. 5 hr because P. aeruginosa died so quickly that no viable cells were recovered at 2 hr and the ED-value was C 5.4 hr because no viable cells were recovered at 24 hr). The differences in D-values and ED-values for the same experimental data ranged from 0 to

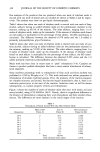
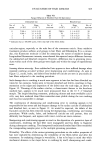
332 JOURNAL OF THE SOCIETY OF COSMETIC CHEMISTS Table I Comparison of D-Values and ED-Values for Cosmetic and OTC-Drug Products Test product Correlation Test organism D-value coefficient ED-value Shower gel Cleanser Cleanser Night cream Sunscreen Sunscreen Sunscreen Sunscreen Facial toner Facial toner Sunscreen Sunscreen Sunscreen Moisturizer Moisturizer Moisturizer Moisturizer Moisturizer Moisturizer Facial toner Shower gel Face product Antidandruff shampoo Antidandruff shampoo Sunscreen Sunscreen Moisturizer Moisturizer Moisturizer Moisturizer Moisturizer Moisturizer Facial toner Facial toner Facial toner Sunscreen Sunscreen Night cream Night cream Night cream Night cream Night cream Sunscreen Shower gel Shower gel Shower gel Moisturizer Moisturizer Moisturizer Moisturizer Moisturizer S. aureus 2.1 - O. 965 S. aureus 7.5 -0.997 S. aureus 6.8 - 0.989 P. aeruginosa O. 5 - 1. O0 S, aureus 2.9 -0.991 Bacillus 5.2 - O. 967 C, albicans 9.0 - 0.993 A. niger 4.5 - 0.999 S. aureus 25 - 0.994 S. aureus 30 - 0.978 S, aureus 3.0 - O. 996 C. albicans 4.0 - 0.995 A. niger 3.5 -0.934 S, aureus 3.1 - 0.993 Bacillus 7.1 - 0.943 E. coli 2.4 - 1.00 P, aeruginosa 1.0 - 1. O0 C, albicans 4.9 - 1. O0 A. niger 4.7 - 0.995 S, aureus 33 -0.974 S, aureus 3.0 -0.992 S. aureus 39 -0.978 S. aureus 8.6 - O. 999 C. albicans 11 - O. 995 S, aureus 4.0 -0.995 S. aureus 2.9 - O. 999 S. aureus 3.0 -0.99 E. coli 11 -0.96 P. aeruginosa 1.0 - 1. O0 P, cepacia 1.0 - 1. O0 C. albicans 4.2 - 1. O0 A. niger 4.5 -0.99 S. aureus 3.7 - O, 993 S, aureus 6.7 - O. 999 S, aureus 3.9 - 0.999 C, albicans 1.8 - 1. O0 Ao niger 5.1 - 0.99 S, aureus 17 - O. 998 Bacillus 10 - 1. O0 P. cepacia 0.1 - 1.00 C. albicans 4.9 - 0.994 A, niger 4.5 -0.993 S. aureus 3.0 - O. 991 S, aureus 15 - O. 999 S. aureus 3.0 - O. 991 S. aureus 7.3 - 0.969 S, aureus 5.1 - O. 99 Bacillus 8.9 - O. 99 E. coli 5.5 -0.99 C, albicans 2.6 - 1. O0 A. niger 3.0 - O. 99 3.1 7.7 7.3 5.4 3.0 4.5 8.6 4.6 27 27 3.2 4.4 4.8 3.3 6.2 3.2 3.8 4.7 4.9 31 3.2 42 9.1 11 4.2 3.3 3.2 9.7 3.5 3.9 3.9 4.7 3.9 6.8 4.3 4.7 5.1 18 10 3.4 4.8 4.6 3.2 14 3.2 7.1 5.4 8.4 5.5 3.5 4.6
Purchased for the exclusive use of nofirst nolast (unknown)
From: SCC Media Library & Resource Center (library.scconline.org)