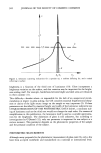
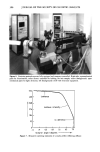
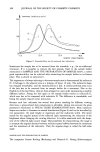
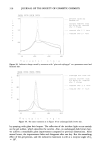
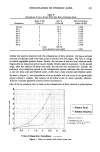
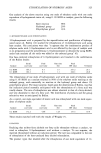
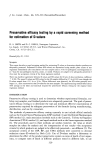
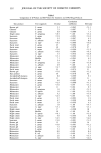
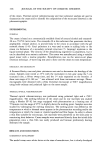
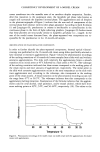
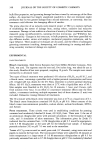
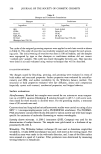
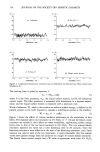
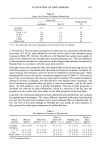
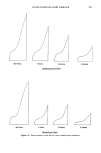
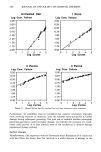
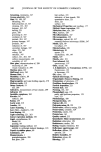
PRESERVATIVE EFFICACY TESTING 333 Table I (continued) Correlation Test product Test organism D-value coefficient ED-value Sunscreen S. aureus 3.1 - 0.990 3.4 Sunscreen Bacillus 6.8 - 0.999 7.0 Sunscreen E. coli 6.6 - 0.989 6.4 Sunscreen P. aeruginosa 0.6 - 1.00 3.6 Sunscreen C. albicans 3.8 - 0.99 3.8 Sunscreen A. niger 7.3 - 0.99 7.4 Sunscreen S. aureus 5.1 - 0.997 5.3 Sunscreen Bacillus ! ! - 0.99 9.9 Sunscreen E. coli 6.3 - 0.97 5.8 D-values and ED-values are in hr. Correlation coefficient is for linear regression used in determining D-values for each sample. 3 hr when the D-values were 10 hr. The mean D-values obtained by use of both methods differed by 0.5 hr (6.6%). The greatest differences in D-values and ED-values were seen in samples in which the test organisms died so quickly that D-values were indeterminant for both the linear regression method (because no viable organisms were recovered at 2 hr) and the rapid screening method. For example, the D-value and ED-value for P. aeruginosa in a night cream were 0.5 and 5.4 hr, respectively. The ED-values were larger than D-values estimated by the linear regression method because data points at 2 and 4 hr allowed closer discrimination of the time at which the test population of organisms was killed as a result of exposure to the preservative system of the product, which enabled a more accurate determination of the D-values than estimating D-values using two APCs. When the D values were indeterminate, (e.g., 0.5 hr, 2.9 hr, 4.5 hr), ED-values were greater than D-values in all but one sample, in which case they were equal. This is desirable for use of the rapid screening method because obtaining ED-values that are larger than the D-values demonstrates that the rapid method generally errs on the conservative side. (Note: The estimated rates of death provided by indeterminant ED- values make it more difficult for the test product to meet acceptance criteria, which means that the rapid screening method provides a conservative estimate of the rates of death of the test organisms). The ED-values obtained by using the rapid screening method were plotted as a function of the D-values in a scatter diagram (Figure 1). The proximity of the data points to a line with a slope of 0.95 hr/hr illustrates the close agreement of the ED-values with the D-values. Linear regression analysis of these data gave a correlation coefficient of 0.98, which indicates excellent goodness of fit of the data to the linear regression. The ED-values tend to level off at around 4 hr. This is due to the rapid screening method being unable to give ED-values much less than 4 hr when using approximately 106 organisms/g test sample and determining APCs at time 0 and 24 hr (see below). The survival curve slope method allowed determination of antimicrobial synergism of formula components and preservatives in multicomponent systems (6). This method allowed determination of D-values and survival times (STs) when APC sampling times are known. In addition, it allowed estimation of the maximum possible D-value (MPD-

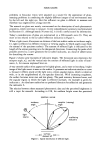
334 JOURNAL OF THE SOCIETY OF COSMETIC CHEMISTS 50 • 40 o Q3 30 '1• 20 I I I 0 10 20 30 40 50 D-Value (Hours) Figure 1. Scatter diagram of the ED-values obtained by the rapid screening method and actual D-values obtained by the linear regression method of 60 cosmetic and OTC-drug samples challenged with different test organisms. value) when the minimum possible ST (MPST) and the APC at time 0 hr are known. It is apparent that products meet preservative system acceptance criteria if the D-value or MPD-value is less than the D-value of the acceptance criteria (i.e., •4 hr for (opportunistic) pathogens, •28 hr for nonpathogens, and bacteriostatic/bactericidal for Bacillus). Use of sufficient concentration of microorganisms in the inoculum (i.e., 106 organ- isms/g in the sample) and sampling at the time to determine the ST or MPST provide sufficient information to determine whether the product meets the acceptance criteria for specific test organisms when using the rapid screening method. The ED-values provided by the rapid screening method are based on MPST and should meet acceptance criteria of the linear regression method. In addition to use of APCs at time 0 and at later times, ED-values have been calculated for scores of samples using a "virtual" survivor curve (6). A virtual survivor curve is made using the APC of the inoculum for each test organism to calculate the initial APC, as is done by the USP method (1), and at other times to obtain ED-values to meet acceptance criteria (i.e., APCs at 24 hr for pathogens and at 7 d for nonpathogenic bacteria, yeasts, and molds). The estimation of D-values using two APCs provides substantial time and material savings over the original linear regression method because a number of samples can be inoculated without the requirement for determining APCs of each test organism in each sample immediately after inoculation and at intermediate time points.
Purchased for the exclusive use of nofirst nolast (unknown)
From: SCC Media Library & Resource Center (library.scconline.org)