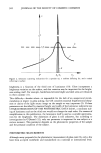
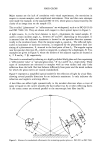
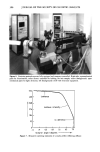
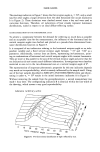
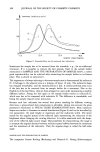
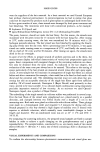
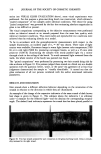
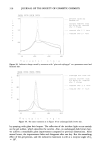
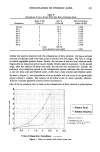
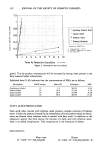
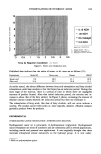
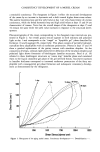
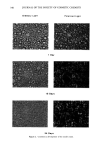
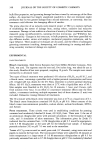
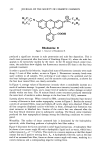
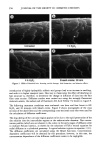
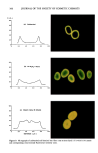
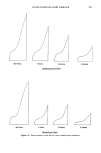
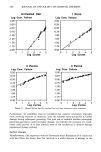
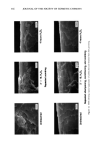
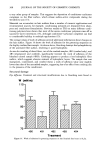
CONSISTENCY DEVELOPMENT OF A MODEL CREAM 341 DESTABILIZATION As Figure 1 indicates, destabilization becomes apparent in the rheogram at 99 days. This instability is characterized by formation of additional spurs and inflections at low shear rates, a shift to lower maximum shear stress values, and a change in the size and shape of the hysteresis loop. In the 99-day rheogram, the low shear rate inflection occurs at 560 dynes/cm 2, while the maximum shear stress value reduces to 1080 dynes/cm 2. An intermediate inflection also occurs at 1000 dynes/cm 2. The rheogram of the 16-month- old sample shows a dramatic growth in the spur. The rapid recoil of the rheogram after the yield value of 770 dynes/cm 2 suggests a weakly associated sample structure that is very unstable to shear. Hints of instability were present in the 34-day rheogram by a slight low shear rate inflection at 400 dynes/cm 2 and a slight recoil after the maximum shear stress value at 1184 dynes/cm 2. Cumulative examination of the rheograms 34 days through 16 months reveals a general trend in the rheogram characteristics as destabilization progresses. The low shear rate inflection shifts toward higher shear stress values and ultimately becomes the maximum shear stress value while the recoil following the maximum shear stress value shifts to lower shear rates. Overall, the maximum shear stress value decreases. As was discussed in a previous work, these secondary inflections can be correlated with three-dimensional network structures (7). The rheogram changes occurring as destabilization progresses indicate successive destruction of a shear-resistant network structure and formation of a network with less shear resistance. As will be proven later, this corresponds to destruc- tion of the liquid crystalline gel network, particle coalescence, and agglomerate forma- tion. The rheogram behavior is consistent with the physical changes in the cream. As destabilization progressed, the cream became softer and grainier. At 16 months, the cream had developed a highly pearlescent, soft texture which, as will be seen later, can be attributed to agglomerated oil phase components. Figure 3 presents photomicrographs of the destabilized creams. Polarized light indicates that instability can be associated with formation of diffuse, weakly birefringent struc- tures that are devoid of a surrounding lameliar liquid crystalline gel network. Ordinary light photomicrographs show that areas corresponding to these weakly birefringent structures are also diffuse. Additionally, ordinary light shows a general increase in droplet size in the remaining liquid crystalline areas. It will be shown that these diffuse, weakly birefringent structures are actually agglomerated oil phase components. At 99 days, instability is not visually apparent in the cream, and the diffuse, weakly birefringent structures are present in a relatively low concentration. However, at 16 months, the cream develops a pearlescent sheen, and distinct areas of lameliar liquid crystalline structures and agglomerates can be identified microscopically when scanning the slide preparation. Examples of these distinct areas from a slide preparation of the 16-month-old sample are shown in Figure 3. Comparison of the photomicrographs of the 99-day-old sample and the area of the 16-month-old sample with no agglomerates shows few differences. However, the photomicrograph of the area of the 16-month-old sample with agglomerates shows numerous small droplets associated with the agglom- erates when viewed with polarized light. These droplets are also devoid of a lameliar surrounding structure and are presumed to be phase-separated isopropyl myristate. These observations are consistent with the phase separation process described by Junginger (8). According to this process, the lameliar gel structure breaks down and the

342 JOURNAL OF THE SOCIETY OF COSMETIC CHEMISTS Ordinary Light Polarized Light 99 Days 16 Months No Agglomerates 16 Months With Agglomerates Figure 3. Destabilization of the model cream.
Purchased for the exclusive use of nofirst nolast (unknown)
From: SCC Media Library & Resource Center (library.scconline.org)