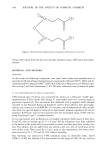
328 JOURNAL OF THE SOCIETY OF COSMETIC CHEMISTS STANDARD SOLUTIONS A stock solution of TRT was prepared, dissolving 100 mg, accurately weighed, in a 250-ml volumetric flask with tetrahydrofuran. Twenty working standard solutions were prepared by diluting this stock solution with THF to obtain an analyte concentration ranging between 0.1 and 60 •g/ml. Analogous standard solutions in pyridine were pre- pared. For HPTLC analysis, ethanolic solutions were prepared in such a way that, loading on the plate volumes of 100 nl, the analyte amount was between 0.01 and 30 •g/deposit. Least squares linear regression was applied to fit plots of signal values versus theoretical concentration. METHODS COSMETICS Carbon extraction. A dispersion of 3 g of the sample, accurately weighed, in 20 ml of THF, was loaded on the carbon column and flushed about 0.5 ml per minute. The col- umn was washed with portions of 2 ml of chloroform for a total of 50 ml, then dis- carded. The analyte was eluted with portions of 1 ml of pyridine for a total of 10 mi. The pyridine flow was not to be higher than 0.1 ml per minute. UV procedure. If the cosmetic was a dermoprotective formulation for general use, TRT determination was directly performed on the pyridinic eluate by derivative spectropho- tometry through the 389-nm and 360-410-nm signals, in second and third derivative spectra, respectively. In the presence of sun filters, a further separation with HPTLC was needed. HPTLC procedure. The solution was filtered through a 0.45-ptm-pore-size membrane, acidified with hydrochloric acid 37% (sample/HC1 1:1.25 v/v) and then extracted with methylene chloride 5 X mi. The extracts were evaporated under a gentle stream of ni- trogen and the residue dissolved in 100 p,l of ethanol. Volumes of 100 nl were spotted 1 cm from the bottom of the plate and 0.5 cm apart and developed with a hexane/ace- tone mixture (6:4 v/v). In these conditions TRT presented a Rf value of 0.72. PHARMACEUTICALS An amount of sample containing a declared amount of 0.5 mg of TRT was accurately weighed and transferred into a 25-ml volumetric flask containing 10 ml of tetrahydro- furan. The flask was vigorously shaken, and the suspension, diluted to volume, was spectrophotometrically analyzed by using the peak-trough 363-413 nm in the third- order derivative spectrum. LABORATORY SAMPLE Synthetic preparations were made by spiking ointment and cream bases with TRT to simulate samples with analyte levels within the range of 0.05 to 200 mg/100g. These samples were used to establish the accuracy of the method. Interference studies were performed, adding the above-mentioned excipients and UV filters in various mixtures and concentrations.

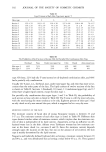
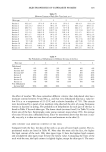
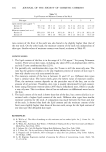
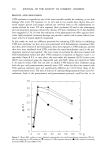
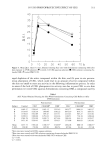
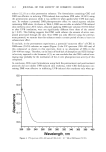
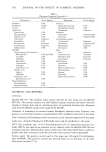
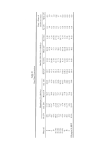
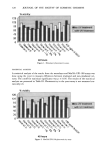
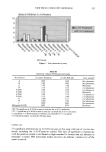
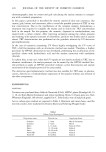
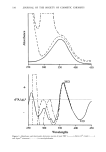
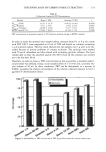
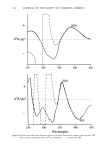
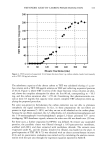
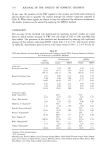
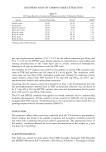
TRETINOIN ASSAY BY CARBON PHASE EXTRACTION 329 RESULTS AND DISCUSSION The commercial forms of skin-care cosmetics contain excipients of very different polari- ties that make it very difficult for the preparation of an analytical sample. Among the high number of solvents tested, tetrahydrofuran gave solutions or clear dispersed phases. Unfortunately, the absorbance spectra in THF, for the commercial samples investigated, were not useful for TRT assay, due to other components totally or partially overlapping the analyte signal (353 nm) or the absorbance increase by turbidity background. In these cases, a derivative spectrophotometric method appeared very helpful, since this technique allows one to obtain a resolution enhancement of the spectral curve and, without prior separation of insoluble excipients, to eliminate broad absorption bands re- sulting from matrix turbidity. For pharmaceutical samples, the peak-trough 363413 nm in the third-order derivative spectra (Figure 1) was found to be very highly correlated with the analyte concentration and not influenced by the other components. The relative regression equation, obtained from data of twenty THF standard solutions, is reported in Table II. Several attempts to apply this procedure to the analysis of cosmetics were unsuccessful, due to the fact that in all cases the TRT signal was completely overlapped by interfering excipients. Therefore, a treatment of the THF samples was necessary. Since there are few references for TRT extraction from whole creams (13,14), different procedures were investigated. When the THF suspension samples were loaded on columns packed with different phases, the active carbon turned out to be a very selec- tive material for TRT, being very strongly adsorbed on this phase. Preliminary experiments to choose the right carbon were made, discarding at first those with a granulometry over 50 mesh to prevent the column occlusion. Therefore, for seven carbon types, reported in Table I, the adsorbability (15) to TRT was evaluated. Ten milliliters of a THF solution of TRT 10 •g/ml were loaded on columns packed with 1 g of each dry carbon type, the eluate collected in a 10-ml volumetric flask and brought to volume with THE The amount of adsorbed TRT was calculated as the dif- ference between the original sample and the eluate concentrations. In a second step, various solvents were tested to select the most efficient one to recover TRT from the column. Pyridine was found to perform the highest recovery for all carbon types, with values ranging from 30 to 95%. On the contrary, chloroform, which pre- sented null extraction of TRT, was chosen to wash the column before the analyte elution. The obtained results, shown in the graph of Figure 2, led to selecting the carbon type Darco 20/40 mesh (Aldrich), showing adsorbability and recovery values of 97% and 90%, respectively. Afterwards, since TRT recovery was demonstrated to be dependent on the elution speed, a recovery value of 98% was achieved, optimizing the pyridine elution speed at about 6 ml/hour. The pyridine eluates obtained by applying this extraction procedure on cosmetic formu- lations show two signals, the 389-nm maximum in the second-order and the 360-410- nm peak-trough in the third-order derivative spectra (Figure 3), due only to the analyte concentration and not influenced by other components. These signal values and the drug concentrations were correlated through the regression equation reported in Table II. The determination limit for this spectrophotometric method was calculated to be 0.3 •g/ml.
Purchased for the exclusive use of nofirst nolast (unknown)
From: SCC Media Library & Resource Center (library.scconline.org)