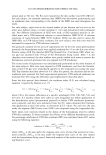
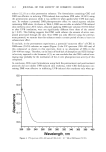
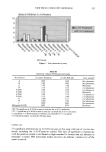
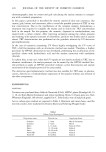
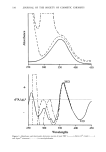
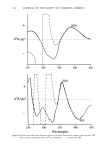
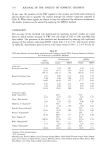
332 JOURNAL OF THE SOCIETY OF COSMETIC CHEMISTS d•'A/d•) t 389 . • I I I I 250 3• 350 400 450 -!- daA/d•. a [-3 I I I I I I 360 I I I ,I • • • 250 300 350 400 450 Wavelengths Figure 3. Second- and third-order derivative s•ectra of pyridinic eluates from carbon column for pure TRT ( ) and a cosmetic formulation (Resriva base ointment) ( .... ), spiked with TRT.

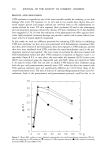
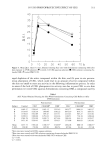
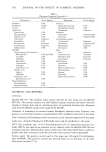
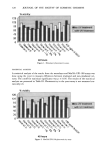
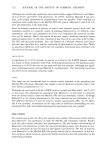
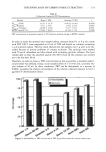
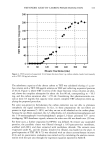
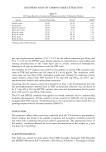
TRETINOIN ASSAY BY CARBON PHASE EXTRACTION 3 3 3 24O 160 - 120 - 80- 40- I I I I I I _I 60 120 0 I I I 0 180 240 300 360 Eluate fractions (mL) Figure 4. TRT recovery of sequential 10-ml eluate fractions from 1-g carbon column, loaded continuously with a TRT 208 •xg/ml solution. The adsorbance capacity of the chosen carbon to TRT was calculated eluting a 1-g car- bon column with a TRT 208-•g/ml solution in THF and collecting sequential portions of 10 ml. Figure 4, where TRT recovery of the eluate fractions versus volumes are plot- ted, shows the complete adsorption for about the first 80 ml, corresponding to --16.5 mg, and the carbon saturation after --270 mi. Considering that pharmaceuticals con- tain at most 0.5 mg/ml, this capacity value assures complete TRT adsorption when ap- plying the proposed procedure. For some sun-protective formulations the carbon extraction was not able to eliminate completely the signal interferences. In fact, in these preparations the sun filters are present in high amounts (5-10%), and they are not at all adsorbed on the carbon phase. Among the sun filters examined, the 2,2'-dihydroxhy-4,4'-dimethoxy-benzophenone and the 1-(4-methoxyphenyl)-3-tert-buthylphenyl) propan-l,3-dione presented UV curves overlapping TRT absorbance signals, whereas the other ones did not absorb over 350 nm. For these cases, a further separation by HPTLC was defined. To remove any suspended particles, the pyridinic eluate was filtered through a 0.45-•m-pore-size membrane, acidified with HC1, and then extracted with methylene chloride. The extracts were evaporated under N2, and the residue, dissolved in ethanol, was loaded on the plate. A good separation of TRT (Rf 0.72) was obtained with an eluent acetone/hexane mixture (6:4), and its quantitative evaluation was carried out by correlating the analyte concen- tration with the spot area through the regression equation reported in Table II.
Purchased for the exclusive use of nofirst nolast (unknown)
From: SCC Media Library & Resource Center (library.scconline.org)