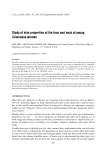
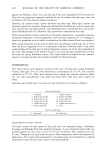
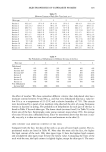
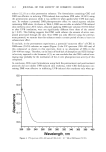
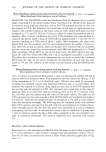
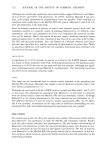
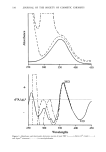
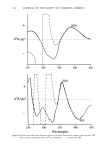
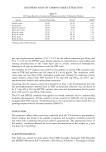
330 JOURNAL OF THE SOCIETY OF COSMETIC CHEMISTS ß • ,'/ V,, ', ,./ I I I I 250 300 350 400 450 daA/dL 3 250 300 350 Wavelengths Figure 1. Absorbance and third-order derivative spectra of pure TRT ( and Apsor © ointment ( ....... ) in tetrahydrofurane. I / \, ! I I I 400 450 ), Retin-A © cream ( .... ),

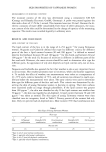
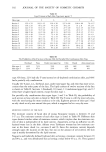
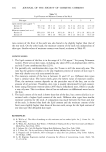
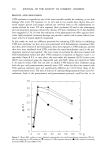
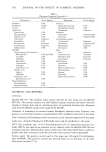
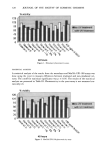
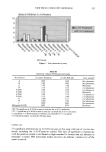
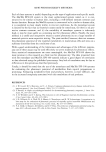
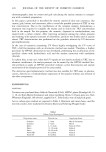
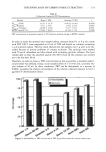
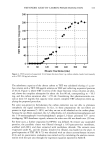
TRETINOIN ASSAY BY CARBON PHASE EXTRACTION 331 Table II Calibration Graphs for TRT Determination Method Slope (_+ SD) Intercept (+_ SD) r 3D363413 (THF) 331.37 + 23.45 --0.0151 --0.011 0.9999 2D•89'(Pyridine) 67.1 1 ñ 5.87 0.541 ñ 0.23 0.9993 3D360,410 (Pyridine) 416.66 + 34.90 -0.217 + 0.15 0.9991 HPTLC (area Rf7.2) 1752.81 -+ 86.65 81.243 + 7.39 0.9990 TRT concentration is expressed as •g/ml in UV-derivative method and •g in HPTLC method. In order to study the optimal ratio sample/carbon, amounts from 0.1 to 6 g of a cream with TRT 0.01% were suspended in 10 ml of THF and loaded on columns containing 1 g of activated carbon. The first result showed that the samples over 3 g were to be dis- carded because of serious problems of column occlusion. The packings were washed with 20 ml of chloroform and then eluted with increasing pyridine volumes. The least volume able to elute the adsorbed analyte (96-98%) from all the columns was verified not to be less then 10 ml. Therefore, in order to detect a TRT concentration as low as possible, a standard analyti- cal procedure was defined, fixing a ratio sample/carbon of 3:1 (w/w) and a pyridine elu- tion volume of 10 mi. In these conditions, TRT can be determined to a percent of 0.0001, revealing the analyte concentration of the relative collected solution to be 0.3 I•g/ml (UV determination limit). 80- Recovery Figure 2. Adsorbability to TRT and recovery of TRT by pyridine elution for various carbon types.
Purchased for the exclusive use of nofirst nolast (unknown)
From: SCC Media Library & Resource Center (library.scconline.org)