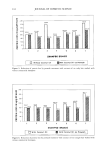
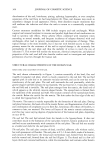
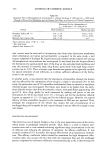
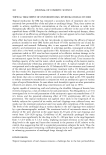
AEROSOL FOAMS 3 5 3 0.97 0.96 0.95 ! A - H-Type ß ' M-Typ O ' L-Type 0.94 , [ i,,, I I [l[I [ [ [ I i i I I 104 10 ø 10 j cationic cellulose concentration (%) Figure 2. Relationship between gas volume fraction (4)) and cationic cellulose concentration. sprayed out. Therefore, the container was shaken ten times by hand before each mea- surement to emulsify the concentrate and the propellant. A tube (ca. 2-ram diameter and 50-ram length) was attached at the top of the spout. Aerosol foam was carefully filled into an empty cylindrical vessel of volume V o (54.46 cm3), and the density of the foam was calculated from the weight difference between the empty vessel, W o, and the filled one, W. Thus, the gas volume fraction, 4), could be obtained from equation 1: 4) = 1 - (W - Wo)/V o (Eq. 1) The bubble structure of the aerosol foams was observed using an optical microscope. An average bubble size (DN) was calculated from the number of bubbles, N, per unit area, using equation 2: D• = (•m) (Eq. 2) The concentrates and the aerosol foams were subjected to rheometry using an MR-3 rheomerer (Rheology Engineering). Flow curves in periodical shear experiments were taken with a concentric-cylinder setup for the concentrates and a cone-plate setup for the

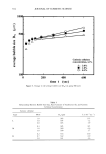
354 JOURNAL OF COSMETIC SCIENCE E 1000 500 lO(• o 200 400 time t (sec) Figure 3. Change in the average bubble size (D N) on aging (M-type). Cationic cellulose concentration, wt% A : 3.0% ß: 1.o% O :0.3% • I 600 Table I Relationship Between Bubble Size (Do) , Rate Constant of Coalescence (k), and Cationic Cellulose Concentration Cationic cellulose Type Wt% D o (pm) k(xlO 4sec •) 1.0 382 13.2 L 3.0 395 7.2 6.0 403 3.9 0.3 385 8.5 M 1.0 389 6.6 3.0 390 3.7 0.2 336 13.0 H 0.7 342 6.9 2.0 341 4.6
Purchased for the exclusive use of nofirst nolast (unknown)
From: SCC Media Library & Resource Center (library.scconline.org)