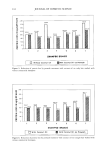
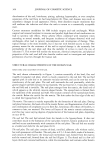
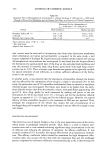
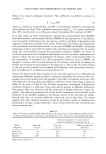
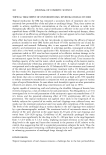
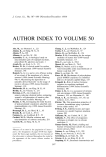
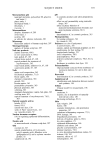
AEROSOL FOAMS 3 57 1000 - 500 - ! ' I ' I (a) 0.7% 100 200 300 shear rate (sec-') • $00 ,4ss• ' I ' 100 200 shear rate (see") • (b) 2.0% 300 • 5O I} 100 200 300 shear rate (sec-') 1000 • 5oo (d) 6.0% 100 200 300 shear rate (see") Figure 6. Flow curves of aerosol foam (L-type). When the apparent rate constant, k, is plotted in a double logarithmic scale against Tic, k decreases linearly, as shown in Figure 5, regardless of molecular weight, with increas- ing viscosity. Thus, the coalescence of the bubbles is uniquely determined by Xl c. Flow curve for aerosol foam. Flow curves for the L-type cationic cellulose in cyclic shearing tests are shown in Figure 6. When the cationic cellulose concentration is low, the flow curves for the aerosol foam show typical shear thinning flow with hysteresis (Figure 6a,b). The absolute value of the shear stress and the shear stress difference between the up and down curves increase with increasing cellulose concentration. Furthermore, the flow curves for higher cationic cellulose concentration show a typical spur on the up curve (Figure 6c,d). They differ from those of lower cationic cellulose concentration. This is a general tendency throughout the whole molecular weight regions. Yield value of aerosol foam. From the flow curves exhibiting shear thinning (Figure 6a,b), Bingham yield values, •'B, were obtained. These values increase linearly with the cationic cellulose concentration on a log-log plot with a slope of about 0.8, as shown in Figure

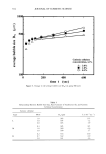
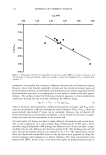
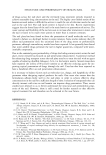
358 JOURNAL OF COSMETIC SCIENCE 10 4 10 3 102 10 ! 104 ' ' I .... I ' ' ' I .... I ' A 'H-type ß 'M-type O ' L-type ' ' I , ,, l. 10 -! 10 0 10 • cationic cellulose concentration (%) Figure 7. Relationship between Bingham yield value (x B) and cationic cellulose concentration. 7, for all the molecular weights of the cationic cellulose. For a given cationic cellulose concentration, 'r B increases with the cationic cellulose's molecular weight. There is also a unique positive correlation between 'rB and qqc, as shown in Figure 8, irrespective of the molecular weight, like the constant k. Therefore, both 'ru and k seem to depend solely on the foam's stability. Apparent viscosity of aerosol foam at maximum shear rate. The apparent viscosity, xlf, at a maximum shear rate of 280 sec -• is plotted against qqc in Figure 9. A similar positive correlation was observed for qqf at the lower region of qqc. When qq• exceeds 0.3 poise, however, qqf tends to deviate from a straight line. The deviation takes place at a lower qq• when the molecular weight of the cationic cellulose is smaller. DISSOLVED STATES OF THE COMPONENTS IN FOAMS We now discuss the dissolved states of the components in foams on the basis of mac- roscopic flow behavior. Although the molecular weights of the cationic celluloses used in this study are different from each other, they all have 0.3-0.4 quaternary ammonium groups per anhydro-glucose unit. This means that one cationic substitution takes place per three glucose units on average. Acyl-glutamate is a dibasic acid. Since the average
Purchased for the exclusive use of nofirst nolast (unknown)
From: SCC Media Library & Resource Center (library.scconline.org)