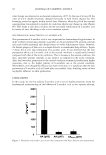
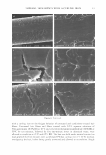
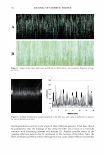
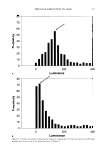
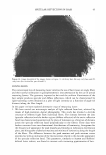
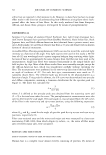
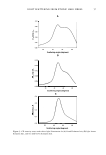
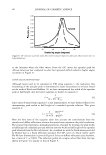
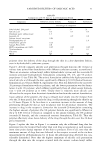
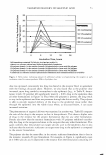
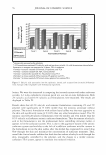
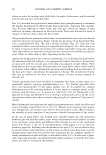
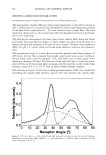
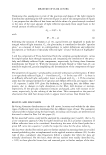
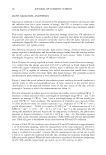
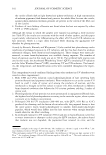
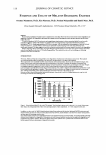
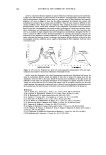
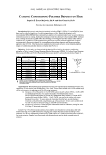
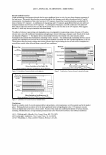
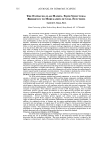
32 JOURNAL OF COSMETIC SCIENCE Figure 1. (A) Image of virgin dark brown hair at close proximity with a digital camera. (B) The inset, without interpolation, shown in Part A, providing higher magnification. Exposure settings: f8, l/l 3s. scanned the image and determined light intensity as a function of the horizontal dis tance. The horizontal lines were one pixel wide and the vertical distance between neighboring lines was four pixels. The graph shown in Figure 6B provides a demon stration of the light intensity profile for one of the lines. As shown in the figure, the plot consists of a complex curve containing a series of peak maxima and minima. The light intensity is measured with the software Sigma Scan Pro 5.0, while the resulting data are

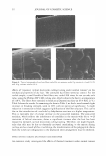
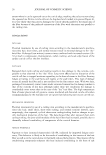
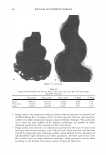
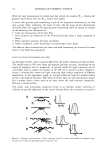
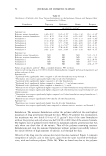
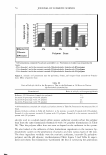
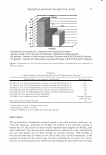
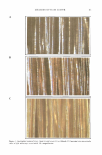
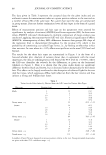
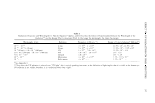
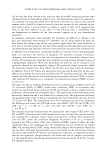
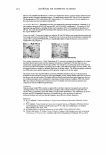
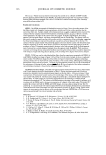
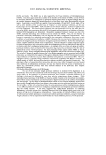
SPECULAR REFLECTION IN HAIR 33 Figure 2. (A) Image of dark brown untreated hair at close range with a Nikon 35-mm SLR camera. (B) Magnification of the inset shown in Part A. exported to a text file and further analyzed with Mathcad 2001 where the luminance values for the various peak maxima and minima were automatically determined by written macros. Each plot of luminance-vs-distance results in two histograms, showing
Purchased for the exclusive use of nofirst nolast (unknown)
From: SCC Media Library & Resource Center (library.scconline.org)