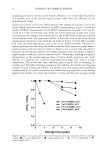
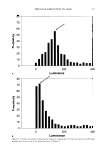
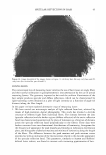
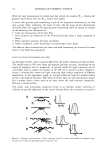
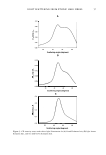
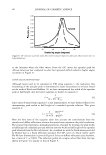
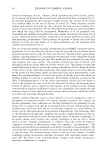
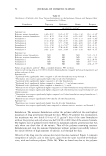
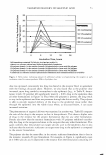
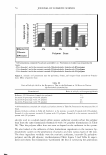
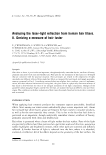
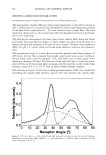
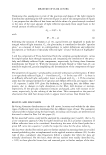
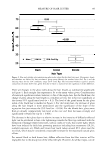
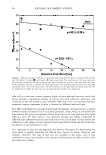
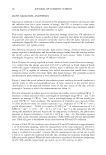
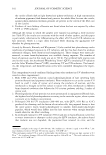
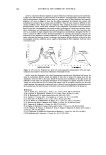
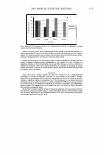
34 JOURNAL OF COSMETIC SCIENCE Figure 3. Image of a human subject's hair in which case reflection is a result of incident natural daylight. the distribution of the peak maxima (Figure 7 A) and peak minima (Figure 7B) in which the frequency of occurrence is plotted as a function of luminance. For each of the 250 maxima and minima histograms, we recorded the luminance value chat occurs with the highest frequency. Such data can be plotted as a function of the position of a horizontal line along the tress, as shown in Figure 8 for both maxima and minima. As expected, the peak maxima histograms provide larger luminance values than the peak minima. Also, a large peak occurs in the peak maxima curve corresponding to the region of the tress where the highest intensity specular reflection band occurs. A smaller peak is also evident for the peak minima curve. Taking the difference between the peak maxima and peak minima curves provides us with an indication of the microcontrast related to the doc-like appearance of the specular reflection band. Table I lists integrated values for the maximum, minimum, and difference curves for various types of hair. The integrated luminance parameters collected in Table I show that the microcontrast, based on the values of [Luminance(max) - Luminance(min)}, increases for hair with greater amounts of pigmentation. For example, dark brown hair provides greater con trast within the specular reflection band than natural white hair. This is in agreement with previous work, which also reported an increase in hair luster for darker hair (see Table I). This was ascribed primarily to higher contrast between the specular and diffuse reflections, which corresponded to different parts of an illuminated hair tress (1). The data presented in Table I suggest that the contrast calculated for doc-like highlights and shadows within the specular band follows the same trend and could be employed for the assessment of hair luster.

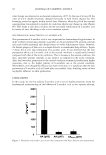
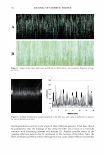
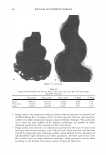
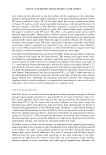
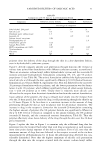
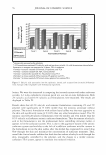
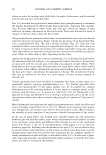
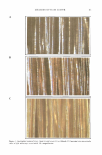
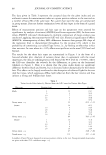
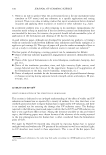
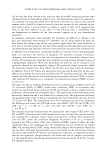
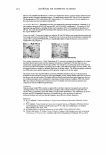
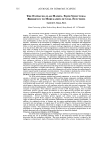
A B SPECULAR REFLECTION IN HAIR 35 11,t1·j,"•, 'l ·1·,:, ,i\Ji'1 I � ,.., • i ''ii' :�•t· . . •I •:1 , · . : l j 'l ' 1 � ' ! } t I', 1 '. 1 ' ' ,:1' , ! ' , I I d . · \ . i t .... , 1 ,. . ' ,, ' • \ I • !I . I '.II 1: . . . . I • ' : • 1,, I I •• • 1 ' , i � • ' ••• • ' •:. , ' , 1 •, I , : . f • . t •, • , ·t ' ·,. i i' r. I . . ,i • ·, . 11 I.·. ·Ir•l ·•1' . .!!-.· ,1 ',l\.i• :, I,' •• I, •• ,�: ,.,. {!'11 . .;. •, :! !.1 1 1 · •• ;.' I t · 1 •· • , • t , ·• ' I \ :, I 'I ·, · ·1 � • , • i , • 1 • • 1 • · , t • • · •· ·t l .' \ . •, I • I I • : I. • ( •• � I' ' � l � . j. 1 · ' • I ,· ' � ' -� . • • . ' • l � . .. . I . i . j ' . ·J '.• . , r . . . f . • : . . \I• t • • • ,,. . • \ ' • • • • I • 1· . · ,·• .,· 1·1··. .. ,i .,•:1,,•.··,,! 1 1\· ·.·t·,." ':· .. :·,·. ,i, · �•�lkf•t• ·•it .,l , ·r.l f 'it l .1 : I I ' ' . • l l .• : J -. ' 1: ... • . I I I. . I . I I •.. , i . lil I, • · • - l , · . 'I '. • , , 1 • ' I I I • l ' e, '• • 0 • 1 ., I ♦ k • i l ·, . . , . \ , ·., . . . : : .,' - \ � i • • j1· .. , " , '. ·, ,. • I I ' . . ' . I • • •• I . • l ♦ l ' • l I • I ' ! i .. I ( I I l ' ! '. , . I l i , • l1 . Ii • I " •• I• ' , \ • . . . . :, • ,:• I! ' •.! I i I .... I • • I · • • 1 t ·.! 1 ' •• / • •: • r � : 1 • 1 • • : • • • • ! • f 1 Figure 4. Images of (A) untreated virgin dark brown and (B) sebum-treated dark brown hair at close proximity. Exposure settings: f8, 1/13s. We also employed image analysis to measure the distances between neighboring mi croreflection centers along the length of fibers. This was accomplished by scanning an image with vertical lines (in contrast to the analysis above with horizontal lines) that were one pixel wide and whose length depended on the length for a particular vertical series of microreflection patterns. The lines were drawn manually with Sigma Scan Pro 5 .0 to ensure that each light intensity plot contained a series of microreflections along a given fiber. After drawing anywhere from 169 to 308 lines, depending on the nature of the image examined, we exported the light intensity data to a text file that could be further analyzed with MathCAD 2001. We then used macros within MathCAD 2001 to determine the distance between neighboring peak maxima for each vertical line in the scanned image. Histograms were then constructed in order to examine the frequency of appearance for the peak maxima data in which a bimodal distribution for each type of hair examined was observed. As an example, Figure 9 contains a histogram for dark brown hair in which the bimodality of the distribution can be observed at distances between peak maxima of 81 µm and 145 µm. Further, Table II provides the frequency of appearance of the peak maxima distances as well as the total sample population of peak maxima distances for various types of hair. Overall, the data shown in Table II suggest that the distances between the reflection centers fall somewhere in the range of 81-145 µm. In almost all cases, the distance between peak maxima of 81 µm occurs with greater frequency than that of 145 µm. In addition to the data presented above, we also examined untreated dark brown hair and the same hair treated with artificial sebum, as shown in Table III. For both peaks, the effect of sebum treatment on the separation distance appears to be negligible and within the experimental error of the calculated average values.
Purchased for the exclusive use of nofirst nolast (unknown)
From: SCC Media Library & Resource Center (library.scconline.org)