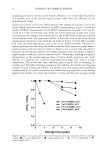
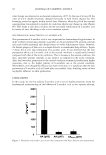
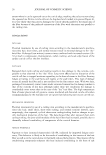
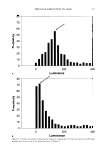
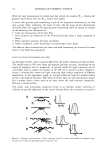
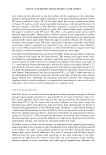
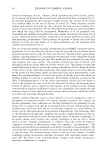
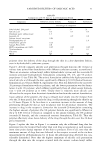
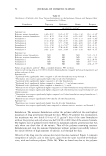
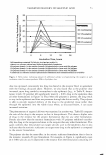
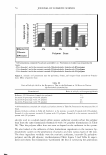
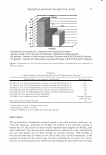
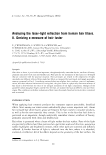
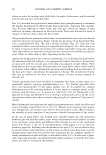
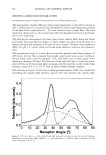
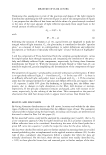
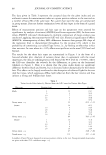
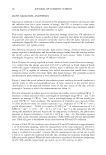
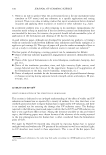
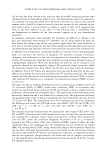
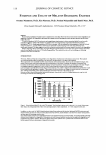
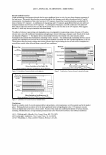
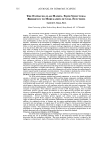
Cl) :::, 0" SPECULAR REFLECTION IN HAIR 39 200 150 100 50 16 48 81 113 145 177 210 242 274 306 339 371 403 435 468 500 532 565 597 629 Distance (µm) Figure 9. Histogram for the frequency of appearance for distances between peak maxima. A bimodal distribution at 81 µm and 145 µm was observed for all hair types analyzed. Table II Frequencies of Appearance for Distances Between Peak Maxima of 81 µm and 145 µm for Various Types of Hair Medium Light Dark Medium Light Natural Oriental brown brown blonde blonde blonde white 81 µm 410 332 262 154 234 222 260 145 µm 228 202 171 154 159 160 190 Total population 1007 878 717 560 669 616 769 Table III Frequencies of Appearance for Distances Between Peak Maxima of 81 µm and 145 µm for Untreated and Sebum-Treated Dark Brown Hair 81 µm 145 µm Total population Untreated 191 176 671 ANALYSIS OF REFLECTION PATTERNS FROM AFRICAN HAIR Se bum-treated 207 158 645 African hair provides an interesting substrate for optical analysis due to the multiple curls that are naturally present. As shown in Figure 10, the curls provide multiple

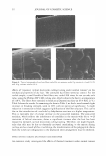
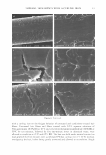
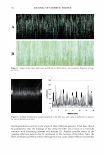
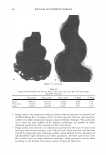
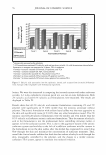
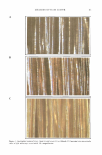
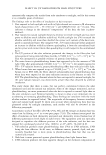
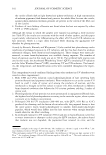
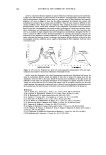
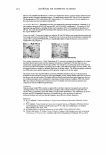
40 JOURNAL OF COSMETIC SCIENCE Figure 10. Image of untreated virgin African hair at close proximity. Exposure settings: f8, 1/13s. reflection patterns in a given African hair sample. It is important to note that unlike straight hair, which exhibits one specular reflection band that coincides with the band on the cylinder mount, homogenous illumination of African hair with a collimated light beam results in multiple reflection centers of equal intensity in all regions of the sample. In order to quantify the multiple reflection patterns, we utilized Image Tool 2.0 soft ware, which allowed us to tally the number of reflection sites as well as to characterize the shape of the reflection. Figure 11 provides images obtained for uncreated hair along with hair treated with 17 mg and 61 mg of artificial sebum per gram of hair. Visual inspection of the images reveals a perceived decrease in luster with increasing concen trations of sebum. Further, the decrease in luster is coupled with a decrease in the number of reflection sites. Figure 12 provides images that correspond to the photographs in Figure 11 in which all of the reflection sites have been isolated on a black background using an image threshold technique with Image Tool 2.0. This is accomplished by looking at a histogram corresponding to the colors present in the image and isolating the
Purchased for the exclusive use of nofirst nolast (unknown)
From: SCC Media Library & Resource Center (library.scconline.org)