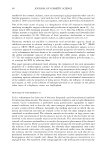
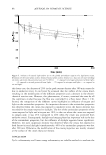
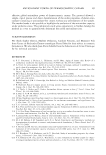
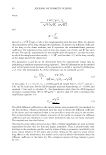
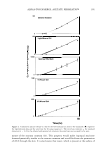
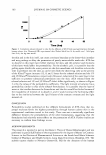
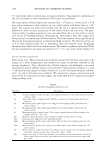
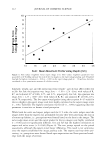
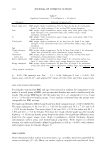
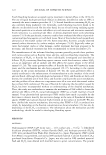
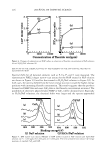
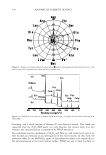
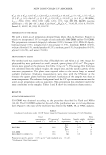
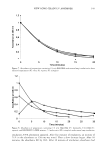
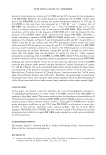
QUANTITATIVE MODEL OF CELLULITE 117 60 160 ... 0 140 • 0 50 ... ... t .. 120 • "'iii "O • LL Cf) ... Q) 100 • • C 40 ... ... Q) • 0 ... ... E 80 ·a, ... • � co ..c co 60 :::J (• a.. Cf) 30 tJ) • • ♦ ♦ tJ) • .c Q) 40 • Ol ♦ C i: .c • I- ♦ Ol 20 20 ♦ ♦ :::J • 0 ♦ 0:: 0 ♦ ♦ 10 20 25 30 35 40 45 20 25 30 35 40 45 BMI (kg/m2) BMI (kg/m2} ♦ Male ■ Males ... Females • Females Figure 5. Male and female comparisons. Males had a significantly lower percent fat in the thigh subregion and significantly lower values for Sdr at comparable body mass indices. The graph shows Sdr · 100 for clarity of illustration. For thigh subregion fat versus BMI, the correlation coefficients were 0. 77 (p = 0.0 l) for males and 0.78 (p 0.001) for females. For roughness Sdr versus BMI, the correlation coefficients were 0.69 (p = 0.03) for males and 0.77 (p 0.001) for females. optical or interference fringe profilometry to determine roughness parameters. For cel lulite, the area of interest is large and the limitations of replica methods become significant. Akazaki et al. (28) described an optical system for direct skin surface mea surements over a 6.4-mm2 area with a high resolution of 12.5 µm. Optical profilometry with CCD sensors allows measurement of depths up to 6 mm (27), and interference fringe projection methods have a 1-mm depth of field (29). These distances are smaller than those encountered with cellulite. Three-dimensional skin surface features have been reported using the non-contact PRIMOS system, which projects parallel stripes onto the surface and determines the third dimension from differences in elevation between the projections and the skin (31,32). Quantitative roughness parameters in the µm range and within a sampling area of 2.4 x 3.0 cm can be measured by this method, indicating the suitability for microtextures. The three-dimensional features of the face and head have been measured with non contact laser surface-scanning systems that record the x,y,z coordinates of multiple points across the surface (33,34). Changes in the range of 2-3 mm could be accurately measured over a relatively large surface area. Rohmer et al. (3 5) recently used fringe projection methods to quantify the roughness parameters and volume of cellulite affected skin. A system to directly measure 3D surface features and quantify wrinkle depth and width has been reported (28). Wrinkle depth was defined as the maximum distance from top to bottom, similar to St (vertical distance from the highest peak to the deepest valley) in this report. We used a non-contact three-dimensional laser surface scanner (resolution of 0. 5 mm) to compute roughness and to provide a standardized, reproducible measure of severity. This system has been used to quantify the surface features of wounds and burn scars and to generate 3D data for the construction of burn masks (36). Since the laser-scanning technique does not use shadows to create the 3D

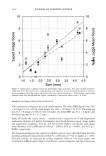
118 JOURNAL OF COSMETIC SCIENCE image, difficulties with lighting were avoided. The 3D images could easily be rotated with the software to provide the investigator with multiple views of the cellulite-affected skin. The subject's position on a rigid platform provided natural thigh compression. The roughness parameters Svm and Sdr were highly correlated with the expert image scores for ten standard images and were, therefore, designated as the quantitative mea sures of cellulite severity. The strength of the agreements (a) between expert image scores and roughness values and (b) between live visual scores and the roughness parameters strongly indicates that the 3D laser scanning and analysis methodology quantitatively characterizes cellulite. The na"ive judge and expert grades were highly correlated (r == 0.96) for the ten images, using the 0-9 scale. Svm and Sdr had the highest correlations to expert and na"ive scores (r 2: 0.86) (Figure 3). The strength of the correlations among na'ive grades, expert grades, and roughness measures confirms that the data quantita tively assesses human perception of cellulite and can, therefore, be used to guide devel opment and evaluation of treatment modalities. To our knowledge, this is the first report of a quantitative assessment of cellulite using 3D laser-scanning technology that also establishes the relationships between quantitative measurements of cellulite severity and human perception of the condition. A combination of biophysical techniques, including standardized, expert clinical grad ing of photographs (wrinkling, rhytids, laxity/tone, etc), roughness parameters (Ra, Rz) from replicas, and subject assessment of improvement, has been used successfully to evaluate treatments on photodamaged facial skin (37). Rao et al. (15) used a combination of high-quality digital photography (multiple angles, tangential lighting), expert image scoring (four trained dermatologists), and subject self-assessment in a paired-comparison design to evaluate cellulite treatments. Surface features were captured from shadows at various angles, but quantitative roughness values were not reported. Bertin et al. (6) concluded that a combination of techniques, including surface macrotexture, biome chanical properties, cutaneous flowmetry, and dermal/hypodermal structure determina tion, were effective in measuring the effect of treatments on cellulite. We found that cellulite severity, measured by expert image evaluation or quantitative surface roughness parameters, was significantly related to the body fat in the affected region, the architecture (surface area) of the dermal-subcutaneous border, and the tissue mechanical properties (compliance, stiffness). The body mass index and correlated an thropomorphic parameters (weight, thigh circumference) were highly associated with cellulite severity. The observed appearance of cellulite, i.e., cellulite severity as measured by surface roughness parameters, depended upon the percent fat in the thigh and the surface area of the dermal-subcutaneous junction. Cellulite severity was predicted by the percent fat in the subregion and the area of the dermal-subcutaneous border. While the biomechanical properties of energy absorption and stiffness correlated with surface roughness, they did not significantly add to the severity. The contributions of subcu taneous fat to cellulite were reported by Mole et al. (38). High-frequency ultrasound coupled with a patient questionnaire indicated that cellulite is caused by defects in adipocyte biology and the superficial fat tissues. Furthermore, the comparison of pa rameters for females and BMI- and age-matched males provided key information re garding the factors that influence cellulite. The outcomes suggest that percent thigh fat and surface area roughness deviation are the distinguishing features of cellulite, given the control for BMI and age in the comparisons. The identification of regional subcutaneous fat and the surface area of the dermal-subcutaneous border as the factors responsible for
Purchased for the exclusive use of nofirst nolast (unknown)
From: SCC Media Library & Resource Center (library.scconline.org)