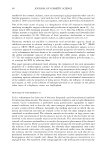
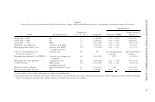
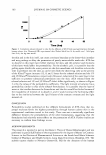
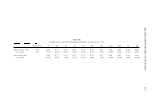
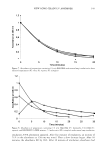
QUANTITATIVE MODEL OF CELLULITE 115 Table IV Morphological, Biophysical, and Anthropomorphic Measurements of Cellulite Females N = 54 Males N = 10 Mean±SE Range Mean ± SE Range Anthropomorphic data Weight (lb) 205.4 ± 7.0 128-331 225.6 ± 12.3 168-290 BMI 34.9 ± 1.2 21.3-56.8 33.2 ± 1.9 26.8-43.3 Age (years) 44.4 ± 1.2 21-60 41.8 ± 3.5 25-57 Thigh circumference (in) 26.9 ± 0.5 21-35 26.0 ± 0.8 23.0-30.5 Cellulite morphology Visual grade 1.0 ± 0.2 0.0--4.0 0.2 ± 0.1 0.0-1.0 Expert image score 4.7 ± 0.4 0.0-9.0 3.8 ± 0.8 0.0-7.0 Sa 1.1 ± 0.1 0.3-2.1 0.8 ± 0.1 0.4-1.3 Sq 1.4±0.1 0.4-2.6 1.0 ± 0.1 0.5-1.6 Sp 3.9 ± 0.2 1.2-8.7 3.4 ± 0.4 1.8-5.9 Sv 5.2 ± 0.3 1.5-12.9 4.4 ± 0.5 2.7-8.0 St 9.1±0.4 3.1-17.9 7.8 ± 0.8 5.0-12.8 Ssk -0.2 ± 0.1 -1.5-0.8 -0.2 ± 0.1 -1.2-0.1 Sku 3.8 ± 0.2 2.2-7.1 4.2 ± 0.7 2.3-8.9 Spm 2.6±0.1 1.0-4.8 2.1 ± 0.2 1.2-3.4 Svm 2.8 ± 0.2 1.0-7.1 2.3 ± 0.2 1.7-3.6 Sz 5.4 ± 0.3 2.0-11.8 4.4 ± 0.4 2.9-6.6 Sdr 0.9 ± 0.1 0.0-3.3 0.01 ± 0.0 0.00-0.01 Body composition % Fat thigh 44.4 ± 1.0 28.8-56.6 20.3 ± 1.7 12.5-27.1 % Lean thigh 53.6 ± 0.9 42.0-69.1 29.0 ± 1.9 19.9-37.0 % Fat subregion 36.8 ± 1.2 18.5-53.7 68.5 ± 1.8 61.2-77.1 3D ultrasound Dermal thickness 1.5 ± 0.0 1.2-2.1 1.7±0.1 1.2-2.0 Ultrasound surface area 352 ± 8 259-470 335 ± 20 283-460 Surface texture photography: red-band SD 14.8 ± 0.5 6.8-22.7 14.9 ± 1.6 9.7-24.0 Biomechanical properties Laxity 1.1 ± 0.0 0.6-1.8 1.0 ± 0.1 0.7-1.3 Laxity% 62.0 ± 0.9 41.8-72.3 60.9 ± 2.2 50.3-69.6 Elastic deformation 1.8 ± 0.0 1.2-2.6 1.7±0.l 1.4-2.0 Stiffness 143 ± 2 115-176 146 ± 4 125-158 Energy absorption 91.2 ± 1.4 67.3-121.4 87.9 ± 2.9 78.2-99.4 Elasticity (mm) 1.0 ± 0.0 0.6-1.5 1.0 ± 0.1 0.8-1.4 % Elasticity 55.3 ± 0.8 43.1-70.8 58.4 ± 2.0 51.7-68.2 of the dermal-subcutaneous border (ultrasound surface area, red-band SD from com pressed images). Cellulite severity was associated positively with tissue compliance (energy absorption) and negatively with stiffness (less stiff, greater severity). The parameters that predict cellulite severity were identified from multiple linear re gression modeling procedures. Expert image score and Svm were selected as the quan titative measures of cellulite severity (dependent variable). The expert image score could be predicted from subregion % fat (p 0.001) and Sdr (p = 0.01), giving the equation: Image Score= -4.2 + (0.22 · Subregion % Fat) + (0.91 · Sdr). The values of R, R2 , and adjusted R 2 were 0.82, 0.68, and 0.67, respectively. Cellulite severity (Svm) could be predicted from subregion % fat (p 0.001) and the dermal-subcutaneous surface area

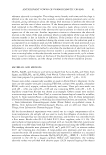
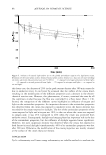
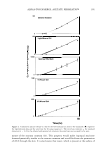
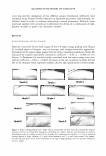
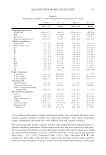
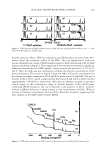
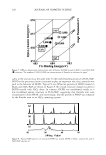
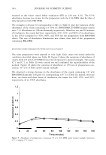
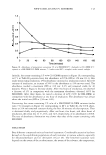
116 Parameter Expert image score Svm Sz Visual grade Age Thigh subregion % fat Ultrasound surface area Elastic deformation Energy absorption JOURNAL OF COSMETIC SCIENCE Table V Significant Correlations "" 0.4 or Higher (n = 56 subjects) Positively correlated with .... BMI, weight, thigh circumference, Svm, Sz, Spm, Sa, Sq, Sp, St, visual grade, thigh % fat, thigh subregion % fat, red-band SD, energy absorption BMI, weight, thigh circumference, expert image score, visual grade, thigh % fat, thigh subregion % fat, ultrasound surface area, stiffness (neg),* energy absorption, red-band SD BMI, weight, thigh circumference, expert image score, visual grade, thigh % fat, thigh subregion % fat BMI, weight, thigh circumference, Sa, Sq, Spm, Svm, Sz, thigh % fat, thigh subregion % fat, ultrasound surface area, red-band SD, stiffness (neg), energy absorption % elasticity (neg) BMI, weight, thigh circumference, Sa, Sq, St, Spm, Svm, thigh % fat, ultrasound surface area, red-band SD, elastic deformation, energy absorption BMI, weight, thigh circumference, Svm, Sz, thigh % fat, red-band SD, elastic deformation, energy absorption, stiffness (neg) BMI, weight, thigh circumference, Spm, thigh % fat, ultrasound surface area, laxity %, laxity (mm), stiffness (neg), energy absorption, elasticity (mm) BMI, weight, thigh circumference, St, Spm, Svm, Sz, thigh % fat, ultrasound surface area, laxity (mm), elastic deformation, stiffness (neg), elasticity (mm) * Neg: negative correlation. (p = 0.02). The equation was: Svm = -2.2 + (0.08 · Subregion % Fat) + (0.006 · D-S surface area), with R, R 2 , and adjusted R2 values of 0.68, 0.46, and 0.44, respectively. MALE AND FEMALE COMPARISONS Ten females, matched for BMI and age, were selected at random for comparison to the males. A second group of BMI- and age-matched females was used to further verify the results. The average BMI (kg/m2) for the males was 33.2 ± 6, compared to 33.4 ± 6 and 33.0 ± 5.9 for the two female groups. T-test analyses confirmed that the groups were comparable for BMI and age. The males and females differed significantly in body composition (p 0.001) (Table IV). The mean subregion % fat was 20.3 ± 5.4% for the males and 36.S ± 7 .2% and 33.8 ± 9.3% for the females. The mean thigh % fat was 29.0 ± 6.1 % for males and 44.5 ± 5.8% and 42.0 ± 7.3% for females. The mean live visual cellulite grade was directionally higher (p = 0.10) for one female group than for the males. No significant differences were found for the expert image score, thigh circumference, dermal thickness, dermal subcutaneous surface areas, and biomechanical properties. With respect to cellulite severity, the males and females differed significantly in Sdr (p 0.005), with substan tially higher values for females (Figure 5). DISCUSSION Three-dimensional skin surface microstructures, e.g., wrinkles, have been quantified by various techniques (27-30). Many use surface replicas coupled with mechanical, laser,
Purchased for the exclusive use of nofirst nolast (unknown)
From: SCC Media Library & Resource Center (library.scconline.org)