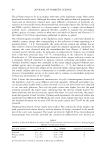
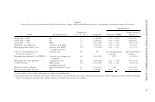
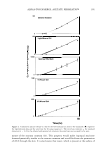
H202/NaF TOOTH-BLEACHING SYSTEM 123 samples of HAP and DCPD, substitute minerals for dental hard tissue, were dispersed in NaF and/or H202 aqueous solutions to investigate the reaction characteristics. A stained anterior tooth, which was offered from a forty-year-old male, was used for analysis of its amino acid composition. REACTION OF HAP AND DCPD NAF AND Hp2 SOLUTIONS The typical experimental procedure was as follows: NaF was dissolved in 20 cm3 of H 2 0 2 solutions (15%, pH 5.0 and 30%, pH 4.7) such that the NaF concentrations were 0.0526-0. 526 mol/dm - 3 , i.e., 1,000-10,000 ppm of fluorine. To these solutions, HAP or DCPD (0.5 g) was added, then stirred in a water bath at 25°C for given times. The HAP or DCPD solids were separated from the solutions by filtration (Advantec Co., filter #2), rinsed with 50 cm3 of deionized water, dried at 105°C, and then examined by X-ray diffraction (XRD) and XPS as shown in the next paragraph. The solutions were analyzed for dissolved Ca2 + and PO/- by ICP-AES (Seiko Instruments Inc., SPS 1500). CHARACTERIZATION OF REACTION PRODUCTS BY XRD AND XPS The treated HAP and DCPD samples were examined by XRD (Rigaku Co., RINT 2000) and XPS (ULVAC-PHI Co., ESCA 5100 Mgk et= 1253.6 eV). The XPS studies were carried out in order to examine the chemical states of elements in the HAP, following our previous work (36,3 7). The powder samples were dusted on polymer film tapes that were mounted on a sample holder. First wide-scan spectra, then narrow-scan spectra for all detected elements were obtained. For characterization of fluorine, an Auger parameter (41), defined as the sum of the binding energy (Eb) for the Fls line and the kinetic energy (Ek) for the F(KLL) Auger line, was utilized. The Ek of the Auger line was plotted against the Eb of the photoelectron line, where the Ek of the Auger line was calculated by subtracting energy at the corrected Auger line position on the spectrum from the photon energy (1253.6 eV), as shown in the equations below. The Auger parameter grids were drawn as a family of lines with slopes of 45 degrees, where all the points on a line had the same value for the Auger parameter because the static charges were rationally cancelled. In the present work, however, the Cls line from adventitious hydrocarbon, which nearly always appears at 284.6 eV, was used for charge correction thus, each chemical state was supposed to occupy not only a whole Auger parameter line but also a unique point on the line: Auger parameter = Eb of Fls line + Ek of F(KLL) Auger line. (Ek of F(KLL) Auger line = 1253.6 - energy at Auger line position on the spectrum.) RESULTS DISSOLUTION OF HAP AND THE FOLLOWING STRUCTURAL CHANGES IN Hp 2 SOLUTION The dissolved Ca2 + and H 2 P0 4 - ions from powdered HAP in H 2 0 2 solution (15%, pH 5.0 and 30%, pH 4.7) were analyzed results are listed in Table I. The dissolution of HAP was accelerated by H 2 0 2 addition, where the driving force was the acidity of the solution as shown, for example, by equations 1 and 2, though the differences due to the concentration of H20 2 were not significant. The pH values in the solutions changed to

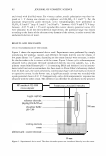
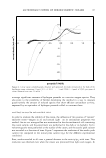
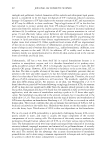
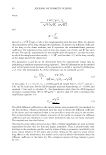
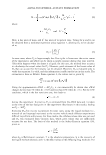
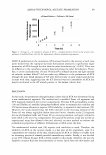
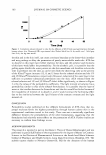
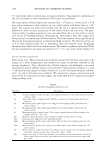
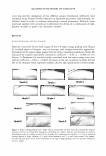
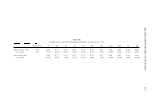
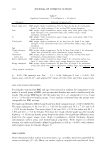
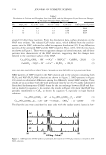
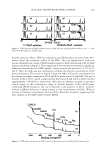
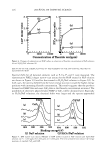
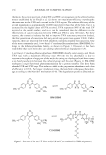
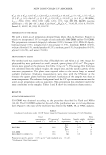
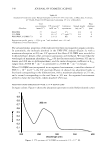
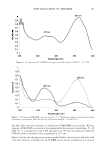
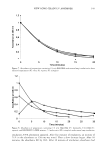
124 JOURNAL OF COSMETIC SCIENCE Table I Dissolution of Calcium and Phosphate Ions from HAP, and the Subsequent Crystal Structure Changes in Hydrogen Peroxide (H202) Solutions No. H2O2 (%) Ca (x 10- 5 mol) P (x 10- 5 mol) Ca/P ratio XRD pattern of product 1 0 0.6 1.1 0.55 HAP 2 15 1.3 1.9 0.68 HAP 3 30 1.4 2.0 0.70 HAP around 6.0 after these reactions. From the dissolution data, surface alterations on the HAP were evident. The released Ca/P molar ratios, which differed from the stoichio metric ratio for HAP, indicated so-called incongruent dissolution (42). X-ray diffraction patterns of the untreated HAP and the HAP treated in H2O2 (15%, 30%) for two hours are shown in Figure 1. There were no apparent changes in crystal structure, and all these patterns were characteristic of the HAP structure, suggesting that the changes were limited to the outermost surface of the HAP. Ca10(PO 4 ) 6 (OH)2 + SH+ ➔ 9Ca2+ + SHPO/- + CaHPO 4 • 2H 2 O (1) CaHPO 4 • 2H 2 O + H+ ➔ Ca2+ + H 2 PO 4 - + 2H2O (2) XRD AND XPS ANALYSES OF STRUCTURAL CHANGE ON HAP TREATED IN H2O2/NAF SOLUTION XRD patterns of HAP treated in the NaF solution and in the solution containing both H2O2 and NaF (H2O2/NaF solution) are shown in Figure 2. XRD patterns in Figure 2(1) reveal no substantial differences among the differently treated HAP samples. These results are in accordance with the work previously done by us (36,3 7): partly substituted fluoridated hydroxyapatite (FHAP) forms by the ion exchange between HAP and fluo ride as shown by equation 3. In contrast, the results in Figure 2(2) show that HAP was partially transformed to CaF2 , as shown by equation 4, especially in high fluoride solutions. Ca 10 (PO 4 MOH)2 + nF- ➔ Ca 10 (PO 4 )6 (OH) 2 _nF n + nOH- (3) Ca 10 (PO 4 MOH) 2 _ n F n + (20 · n)F- ➔ 10CaF 2 + 6Po/- + (2 · n)OH- (4) The fluoride ions were considered to react only with the surface atomic layers in low- 20 30 40 2 8 (deg. Cuka) 50 Figure 1. XRD patterns of HAP power: (a) untreated (6) treated in 15% H2O2 solution (c) treated in 30% H202 solution.
Purchased for the exclusive use of nofirst nolast (unknown)
From: SCC Media Library & Resource Center (library.scconline.org)