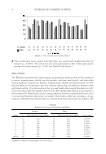
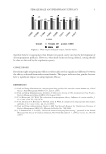
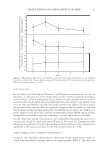
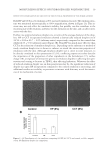
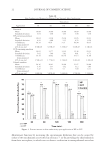
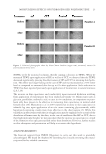
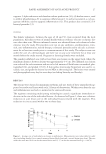
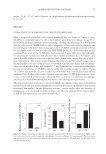
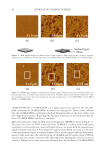
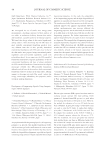
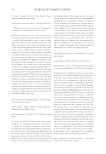
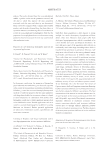
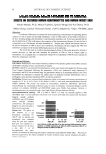
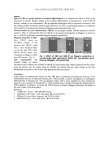
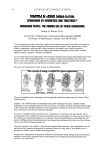
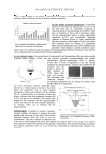
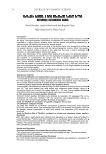
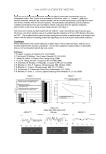
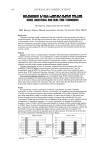
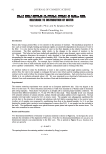
MOISTURIZING EFFECTS OF HYDROGENATED POLYISOBUTENE 19 EFFECT OF THE EMOLLIENTS HP AND CCT ON THE PHYSICAL PROPERTIES OF THE FORMULATIONS Both HP and CCT in o/w emulsions at 8% increased emulsion viscosity. The emulsion struc- ture was monitored microscopically, at 400´ magnifi cation, shown in Figure 2A. This in- crease may not only affect the emulsion’s stability, but possibly can also contribute to the microstructure of the emulsion, and hence its fi lm formation on the skin, and can affect inter- action with the skin. Further, we analyzed emulsion droplet size, in terms of the average diameter of the drop- lets. HP or CCT incorporated emulsions showed a dramatically reduced droplet size of 18.58 ± 2.02 or 26.7 + 4.05 (arbitrary units), respectively, compared to the control that exhibited 65 ± 9.56 (arbitrary units) (Figure 2B). Thus HP was much more effective than CCT in the reduction of emulsion droplet size. Depending on the substance or method of study, emulsion droplet size is shown to enhance or retard the interaction properties of emulsions with the skin. Although emulsion droplet size is cited, in some instances, to be directly correlated to skin penetration (15,16), confl icting reports exist that describe the importance of the proportion of other ingredients in the formulation (17), surface charge (18), or exposure of interactive species on emulsion droplets in affecting skin pen- etration and causing a decrease in TEWL, thus affecting hydration. Whatever the effect of reduced emulsion droplet size on skin penetration may be, the signifi cant reduction of droplet size upon HP incorporation compared to the control emulsion is interesting, and additional studies on its ability to penetrate or interact with skin may reveal the intrica- cies of its mechanism of action. Figure 2. (A) Visualization of o/w emulsions comparing 8% HP, 8% CCT, and control, at 400× magnifi - cation. (B) Emulsion droplet size comparison.

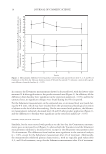
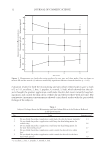
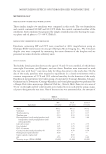
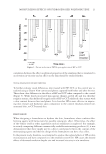
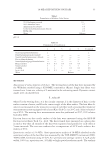
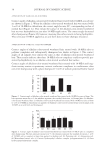
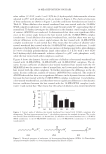
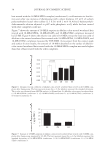
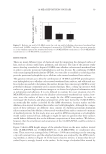
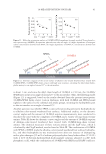
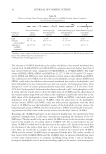
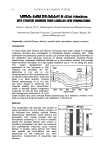
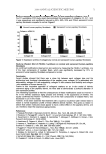
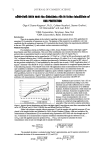
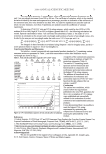
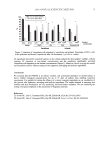
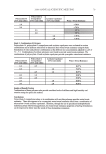
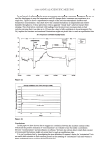
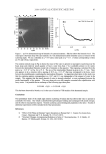
JOURNAL OF COSMETIC SCIENCE 20 QUANTIFICATION OF THE MOISTURIZING EFFECT Measurement of transepidermal water loss (2,4,5) and of increased skin conductivity (1) are useful tools in assessing the effectiveness of moisturizers in skin hydration. Hence we further analyzed the o/w emulsions HP and CCT or a control formulation for skin mois- turization using these two techniques. Data presented below include the effects of HP and CCT on reduction in TEWL (Table II Figure 3) and skin conductance (Table III Figure 4). Mean TEWL obtained for the untreated site at each time interval was sub- tracted as a correction factor from the TEWL obtained for the HP- or CCT-applied site, to derive the respective corrected means. Upon application of HP or CCT there is a gradual decrease of TEWL and an increase in skin conductance with time. A maximal decrease of TEWL by 33.36% was observed with HP treatment compared to the control at the 3-h time point. This reduction was maintained for up to 6 h. It can be clearly seen that, at all time points, both HP and CCT were signifi cantly better than the control for- mulation in reducing TEWL. Furthermore, at all time points, HP demonstrated greater reduction when compared to CCT. Six hours after application, HP was signifi cantly better (p 0.001), exhibiting a long-lasting moisturizing effect. Corneometer readings of the HP- or CCT-applied skin were taken as a measure of skin conductivity and were normalized against untreated skin, as for TEWL measurements. These readings increased dramatically by 45% to 50% within 20 min of CCT or HP applica- tion, respectively, compared to that with the control formulation (3.47% only). At all time points of analysis, HP performed signifi cantly better than the control formulation (p 0.001), whereas the difference of CCT from the control showed a signifi cance probabil- ity value of p 0.5. The mechanism by which both compounds contribute to the capacity of the skin to hold water may not just be related to their fi lm-forming properties, but to their effect on the emulsion properties and the organization of water droplets in it. The Table II Transepidermal Water Loss Measured at Various Time Intervals After Application Time (min) Application 20 60 120 180 360 Untreated Mean 8.22 8.23 8.23 8.23 8.22 Standard deviation 1.03 0.92 1 1.08 0.96 HP-containing emulsion Mean 5.27 4.17 3.68 3.43 4.61 Standard deviation 1.1 0.99 0.69 1.15 1.46 % Difference from untreated -28.32 -43.23 -49.98 -53.33 -37.26 p(Tt) one-tail 1.88E-04 1.18E-06 3.21E-05 2.58E-05 1.86E-03 CCT-containing emulsion Mean 5.51 4.48 3.91 3.47 5.19 Standard deviation 0.67 1.07 1.04 0.96 0.79 % Difference from untreated -24.59 -38.46 -46.46 -52.55 -29.04 p(Tt) one-tail 2.38E-01 3.03E-01 2.70E-01 4.69E-01 1.51E-01 Control emulsion Mean 7.73 7.36 6.97 6.77 7.31 Standard deviation 1.32 1.33 1.55 1.42 1.34 % Difference from untreated -8.57 -12.98 -17.63 -19.97 -13.59 p(Tt) one-tail 1.42E-02 2.01E-02 1.56E-02 6.28E-02 1.57E-02
Purchased for the exclusive use of nofirst nolast (unknown)
From: SCC Media Library & Resource Center (library.scconline.org)