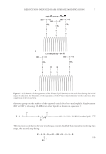
EFFECTS OF LIPID EXTRACTION AND SOAKING 15 EXPERIMENTAL PROCEDURE Prior to entry into the studies, subjects refrained from using moisturizer on their fore- arms for 72 hours. Two 2 × 2-cm treatment sites were marked on each volar forearm. Panelists acclimated to environmental conditions (temperature 21° ± 1°C and relative humidity 31% ± 5%) for 30 minutes before initial measurements were collected. Base- line measurements of transepidermal water loss (TEWL, g/m2/hr) and the rate of mois- ture accumulation (MAT, cru/sec) were made for all sites. Biophysical measurements were collected again at 0.25, 0.5, and 4 hours following treatment. TREATMENTS The skin was exposed to three treatments: (a) acetone/ether, (b) water soak, and (c) ace- tone/ether followed by a water soak. Untreated skin served as the study control. The treatments were randomized both up and down and between arms. Acetone/ether extraction. One site on each forearm was treated with a 1:1 mixture of acetone and ether (A/E) to remove surface and intercellular lipids from the outer lay- ers of the SC. The sites were exposed to A/E for ten minutes using a glass extraction cup to hold the solvent. The areas were continuously rubbed with a cotton swab dipped in the A/E mixture during this time. Following extraction, the biophysical measurements were repeated on the extracted sites to quantify the immediate post- extraction state. Soaking. Once the extraction was complete, one forearm was soaked in fresh water (tem- perature 40° ± 2°C) for ten minutes and blotted dry. The sites on the other, unsoaked, arm served as control. Biophysical measurements were repeated on all test sites 15 min- utes, 30 minutes, and four hours after soaking. NMF MEASUREMENTS Skin surface sampling. At the end of the measurement period, four hours after soaking, and after collection of all biophysical measurements, SC samples were serially col- lected on all treatment and control sites. Two different sizes of tapes were used in these studies: for sample collection, 14-mm tapes were used for desquamation be- tween the collected samples (tapes 2, 4, 6–9, and 11–14), larger, 22-mm tapes were used to help ensure that the collected samples refl ected a consistent SC depth. Each sampling tape was placed on the skin, rubbed once with the collector’s thumb, and removed immediately by tweezer. The next tape was placed in the same location but removed from a different angle to ensure overall evenness of desquamation. The col- lected sampling tapes were placed in snap-cap centrifuge tubes and stored at -18 degrees Celsius until analysis. Preparation of standards and calibration curves. The stock solution was diluted 1:100 with a further 10 mM HCl. A calibration curve for citrulline was prepared using the amino acid acidics and neutrals standards as follows: Four separate dilutions, 1/200, 1/200, 1/75, and 1/50, of the stock solution (2.5 μmol/ml) were prepared using 10 mM of HCl. A 2.5- μmol/ml solution of citrulline in 10 mM of HCl was prepared by weighing 4.38 mg of citrulline into 10 ml of 10 mM HCl and analyzed in triplicate against the acidics and

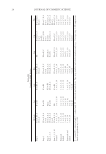
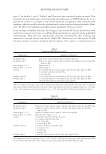
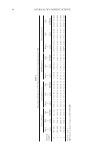
JOURNAL OF COSMETIC SCIENCE 16 neutrals calibration curve following the same preparation for HPLC analysis as the sam- ples, with the exclusion of the internal standard. Once the citrulline concentration was validated, a calibration curve for the samples was generated using amino acid standard H, as seen in Table I. AABA internal standard stock solution was prepared by weighing 2.5 mg of AABA into 10 ml of 10 mM HCl. Two milliliters of this solution was diluted to 50 ml with a further 10 mM of HCl. All stock solutions were stored refrigerated until use. Quantitation of NMF. The tapes were extracted with 300 μl of 6mM perchloric acid spiked with 10 μl of 2 μmol/ml α-amino-n-butyric acid (AABA) at room temperature for three hours. After three hours, the extract was removed by micropipette to a fresh microcentri- fuge tube, while the tape was reserved in the original tube for protein analysis. For HPLC analysis, 20 μl of extract and 30 μl of 0.2 M sodium borate buffer, pH 8.8, were added to HPLC microvials, derivatized with 10 μl of AccQ-Fluor for fl uorescence detection, and vortexed for fi ve seconds. Samples were analyzed using the AccQ-Tag system (Waters Corp.) with gradient elution (Eluent A: Waters AccQ-Tag Eluent A [one part to ten parts deionized water] Eluent B: 45% ACN, 15% MeOH, 40% H 2 O [w/w] see Table II) on a C-18 reverse-phase column (25-cm length, 4.6-mm internal diameter). The excitation wavelength was 250 nm with emission at 395 nm. The column temperature was 40° C with a run time of 40 minutes. The HPLC results were standardized to the amount of protein removed by the individual tape using the Pierce BCA protein assay (14). After NMF extraction, the tapes were re- extracted using a solution of 300 mM urea + 2% w/w sodium lauryl sulfate. Three hun- dred microliters of this solution was added to each microcentrifuge tube and vortexed for one minute before being refrigerated overnight. The following morning, the samples were warmed back to room temperature, placed in a 60° C water bath for 30 minutes, sonicated for six minutes, then vortexed again for one minute. At this point, the spent tapes were discarded. A 96-well plate was fi lled, in triplicate, with 25 μl of this protein extract and 200 μl of Pierce working reagent in each well. A calibration curve with con- centrations of 6.25, 12.5, 25, 50, 100, 200, and 400 μg/ml was prepared by serial dilu- tion of an 800-μg/ml BSA stock solution (in water). The plates were incubated at 37°C for one hour, and then read on a spectrophotometer at 562 nm. BIOPHYSICAL INSTRUMENTATION Transepidermal water loss (TEWL, g/m2/hr) was determined using a DermaLab evapo- rimeter (Cortex Technology, Denmark). The rate of moisture accumulation (MAT, cru/sec) Table I HPLC Standard Curve Preparation Amounts Target concentration AA standard H Citrulline stock 10 mM HCI 12.5 nM/ml 5 μl 5 μl 990 μl 25 nM/ml 10 μl 10 μl 980 μl 50 nM/ml 20 μl 20 μl 960 μl 75 nM/ml 30 μl 30 μl 940 μl 100 nM/ml 40 μl 40 μl 920 μl 250 nM/ml 100 μl 100 μl 800 μl 500 nM/ml 200 μl 200 μl 600 μl
Purchased for the exclusive use of nofirst nolast (unknown)
From: SCC Media Library & Resource Center (library.scconline.org)