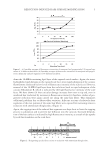
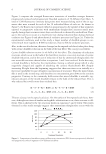
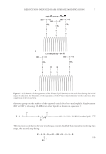
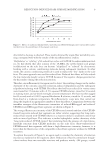
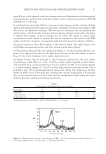
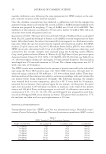
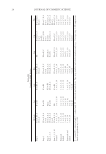
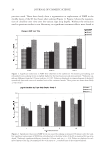
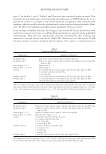
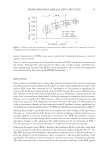
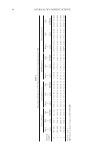
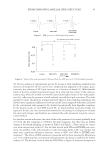
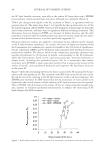
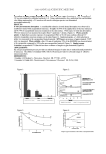
REGENERATION OF NMF 27 tape 15 in Studies 1 and 2. Tables I and II provide the statistical results in detail. One potential clinical implication of the observed initial decrease in NMF followed by its re- generation is that it is related to the initial sensation of tightness often reported after washing, which generally subsides spontaneously within the fi rst hours afterwards. How- ever, the effects on tightness and other sensory parameters were not tested. In an attempt to further elucidate the changes caused in the SC by the fresh-water soak and their evolution over time, we added pH measurements to our previously published methodology. Skin pH was signifi cantly elevated immediately after soaking but returned to normal within four hours (Table III). Maintenance of the native SC pH has been shown to repair moderate barrier defects (12), and so a natural return to Table I Signifi cant NMF Results, Study 1 Comparison Signifi cant differences By depth, tape 3 Soak at 0.5 versus control soak at 4 hr for Arg only By depth, tape 5 Soak at 0.5 versus control soak at 4 hr for total amino acids, Ser, Gly, His, Arg Cit, Phe Sum of tapes 1, 3, 5 Same as tape 5 Sum of tapes 1, 3, 5, 10 Same as tape 5 Control 1 vs all other tapes for total amino acids, Ser, Gly, His, Arg, Cit, Phe 3 vs all for total, Ser, Gly, His, Phe 3 vs 10 for Arg Soaked, time 0.5 1 vs all other tapes for total amino acids, Ser, Gly, His, Arg, Cit, Phe Soaked, time 4 1 vs all other tapes for total amino acids, Ser, Gly, His, Arg, Cit, Phe 10 vs all other tapes for all amino acids except Cit Time 0.5 indicates the tape strips collected from the soaked sites 0.5 hours after the soak. Time 4 indicates tape strips collected four hours after the soak. Tape strip numbers are listed as numbers only, e.g., 1 for tape strip 1. All comparisons listed are signifi cant at p 0.05. No signifi cant differences were found at strip 1. Table II Signifi cant NMF Results, Study 2 Comparison Signifi cant differences By depth, tape 3 Soak at 0.5 versus control soak at 4 hr for total amino acids, Ser, Gly, His, Arg By depth, tape 5 Soak at 0.5 versus control soak at 4 hr for total amino acids, Ser, Gly, His, Arg Cit, Phe Sum of tapes 1, 3, 5 Soak at 0.5 versus control soak at 4 hr for all except Phe Sum of tapes 1, 3, 5,10 Same as sum of tapes 1, 3, 5 Control 1 vs all for total, Ser, Gly, His, Arg, Cit 10 vs all for total, Ser, Gly, His 1 vs 5, 10 for Phe 3 vs 10 for Arg, Phe Soaked, time 0.5 1 and 3 vs 10 for Ser, Gly, His, Arg 1 vs 5 for Ser, Cit 3 vs 10 for Ser 3 vs all for Cit Soaked, time 4 1 and 3 for total amino acids, Ser, Gly, His, Arg Cit, Phe All comparisons listed are signifi cant at p 0.05. Time 0.5 indicates the tape strips collected from the soaked sites 0.5 hours after the soak. Time 4 indicates tape strips collected four hours after the soak.

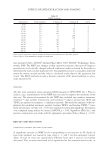
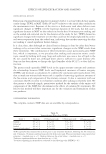
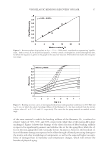
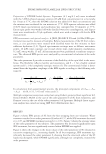
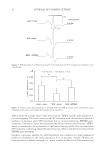
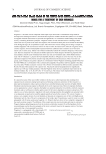
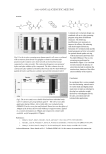
JOURNAL OF COSMETIC SCIENCE 28 pre-perturbation levels within a relatively short time frame is necessary for basic skin health. Some studies hypothesize that NMF components are directly responsible for acid mantle formation (18,19). We found a negative correlation between pH and NMF levels in Study 1, which supports this conclusion. Clearly, a sequence of events has been initiated in the SC by this brief soak, perhaps due to removal of NMF and leading to NMF generation and a rebalancing of SC pH. A signifi cant reduction in MAT due to soaking (Table IV) was found to persist until the four-hour point in Study 1. MAT was not signifi cant 15 minutes post-soak, possibly due to residual moisture from the soak itself. The control site was signifi cantly different from the soaked site both 30 minutes and four hours post-soak. These conclusions were not duplicated in our second study however, the fi rst study took place in September and the second in February. Differences in environmental conditions (average relative humidity in Cincinnati in September is 88% in February, 71%) led to extremely low MAT values for all times in Study 2, possibly leading to diffi culty resolving differences between treat- ments and times due to use of the extremes of the measurement range of the device. The data from both studies were combined for analysis, but the difference between the fi rst and second studies was directional (p=0.07, t-test). TEWL is the generally accepted method of measuring barrier damage (20). In our previous studies involving soaking of the skin (14), consistently non-signifi cant differences in TEWL validated the lack of bar- rier damage due to soaking of the skin. For this reason, TEWL measurements were dis- continued and pH measurements were added (Table III). Table III Effect of Soaking on Skin Surface pH Baseline .25 Hours post-soak 4 Hours post-soak Study 1 5.46 ± 0.13 6.14 ± 0.14* 5.53 ± 0.13* Study 2a 5.68 ± 0.07 6.02 ± 0.08 5.79 ± 0.08 Soaking caused a signifi cant elevation in SC pH in Study 1, which returned to normal after four hours. pH was measured for each site prior to any treatment (baseline), and 15 minutes and four hours after the fresh- water soak. The values are mean ± standard error (Study 1, Study 2). a Covariates appearing in the model for Study 2 (the model contained time, subject, logTotal, and SDT) are evaluated at the following values: logTotal = 3.0 SDT = 7740.0 (no covariates were used in analysis of Study 1). *Indicates signifi cant difference from baseline, p ≤ 0.05. Table IV Moisture Accumulation Test (MAT) Control site 4 hours post-soak Soaked site at baseline Soaked site 0.5 hours post-soak Soaked site 4 hours post-soak Study 1 0.60 ± 0.08 0.65 ± 0.47 0.24 ± 0.09* 0.31 ± 0.09* Soaking produced a signifi cant decrease in MAT values that persisted for the study duration. The rate of moisture accumulation (MAT) (cru/sec) was measured for each site prior to any treatment (baseline), and 15 minutes, 30 minutes and four hours after the fresh-water soak. The data collected 15 minutes after the soak are omitted, as the arms were still wet. The values are reported as estimated slope of the regression line as gener- ated by univariate GLM procedures and are mean ± standard error (Study 1). *Indicates signifi cant difference from control, p ≤ 0.05.
Purchased for the exclusive use of nofirst nolast (unknown)
From: SCC Media Library & Resource Center (library.scconline.org)