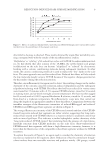
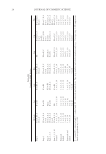
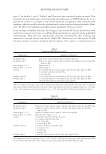
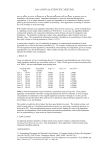
EFFECTS OF LIPID EXTRACTION AND SOAKING 17 was measured with a NOVA® Dermal Phase Meter 9003 (NOVA® Technology, Ports- mouth, NH). The MAT uses changes in skin capacitive resistance (the ratio of charge to potential on an electrically charged isolated conductor) under occlusion by the probe to determine the extent of skin hydration (15). Transepidermal water accumulates under the sensor for twenty seconds and the value is calculated as the slope of the regression line (cru/s). The MAT method provides a dynamic measure of SC water handling, as previ- ously reported (16). STATISTICS All data were examined using univariate GLM measures in SPSS (SPSS, Inc.). Prior to analysis, log 10 transformation of the NMF data was used to improve the normality of the data sets. The statistical assessment for the NMF data included tape number, treatment, treatment * tape number (interaction), and treatment * subject (interaction). MAT and TEWL are reported as estimates ± confi dence intervals. The model for analysis of the bio- physical data included treatment, panelist, baseline TEWL, and baseline TEWL * treat- ment (interaction). A value of p 0.05 was considered statistically signifi cant. Treatments were compared using analysis of variance (ANOVA, p 0.05, SigmaStat, SPSS, Inc.), and pairwise comparisons were made with the appropriate procedure (Tukey, Dunn, p 0.05). RESULTS AND DISCUSSION UNTREATED CONTROL AND EFFECTS OF DEPTH A signifi cant increase in NMF levels corresponding to an increase in SC depth (as tape strip number) was found for tape strips 1, 3, and 5 for the untreated control. Tapes 10 and 15 were not signifi cantly different from tape 5 and are not further discussed. This increase was found to be signifi cant for the summed amino acids, as Table II HPLC Gradient Time (min) Flow (ml/min) % Eluent A % Eluent B Curve 0.00 1.0 98 2 15.00 1.0 93 7 6 16.00 1.0 87 13 6 27.00 1.0 68 32 6 30.00 1.0 68 32 6 31.00 1.0 0 100 6 37.00 1.0 0 100 6 38.00 1.5 98 2 6 40.50 1.5 98 2 6 41.00 1.0 98 2 6 50.00 1.0 98 2 6 60.00 1.0 0 100 6 100.00 0.0 0 100 11 Curve type 6 represents a linear change of solvent concentration over the time period. Curve type 11 is an immediate change of conditions.

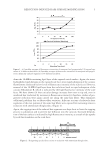
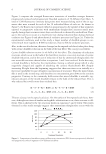
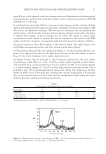
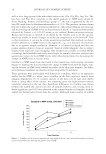
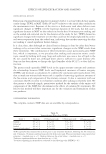
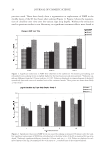
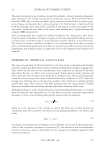
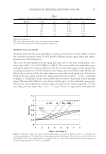
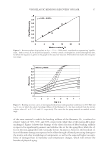
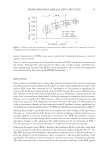
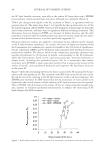
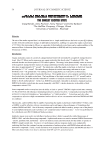
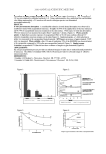
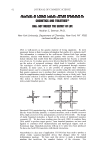
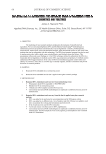
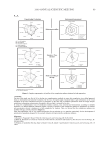
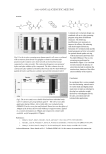
JOURNAL OF COSMETIC SCIENCE 18 well as for a large group of the individual amino acids: Glu, Gly, His, Arg, Cit, Thr, Lys, Leu, and Phe. This correlates to the depth gradient in NMF levels shown by Scott, Harding, Bowser, and Rawlings’ group (17,18) and is supported by the iso- lated SC work done by Hashimotokumasaka et al. (19). The gradient increase shown here fi ts within the scale of resolution offered by confocal laser Raman spectroscopy, and the leveling off of NMF levels at deeper layers of the SC is consistent with results obtained by Caspers et al. (20–22) using in vivo confocal Raman microspectroscopy. Raman spectroscopy is limited in its depth by the models used to fi t the spectra, which are unable to match changes in molecular composition in the lower SC. Due to this limitation, it can not be a truly quantitative method. Our method can detect smaller differences in NMF levels in the upper SC, e.g., as a function of treatment, due to its greater sample resolution. However, it is limited in depth and does not permit analysis down to Caspers’ reported “band of stable fi laggrin” due to subject trauma from repetitive tape stripping. Our method uses readily accessible HPLC technology and affordable and easily stored tapes for sample collection, and provides quantitative values for local NMF levels, rather than being limited to measuring the change in NMF levels at various strata. Gradients in NMF levels were also found in the treated sites, with varying curvatures (Figure 1). Soaking the skin exacerbates the change in NMF levels with SC depth, mak- ing the decrease in NMF levels towards the surface of the skin more dramatic. No differ- ences between treatments are observed at tape strip levels 10 and above. These gradients were particularly well-defi ned for citrulline, which is an important marker for the NMF as a whole, since citrulline in the skin originates entirely from fi laggrin degradation (3). A covariate analysis of the data over all tape strip depths shows a strong effect of the subject, not surprising given the high person-to-person variability observed in the raw data. Signifi cant differences in citrulline were shown between the soaked and control sites over all samples, however, and a strong trend to- wards signifi cance (p=0.053) was observed in the summed amino acid samples, with the soaked site having lower levels than the control. Although minor sources of soluble Figure 1. Citrulline levels increased signifi cantly with depth in the SC, and varied with treatment, with the extracted and soaked site showing the greatest loss of NMF.
Purchased for the exclusive use of nofirst nolast (unknown)
From: SCC Media Library & Resource Center (library.scconline.org)