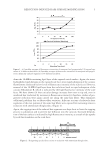
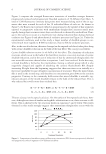
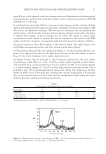
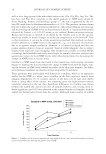
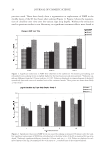
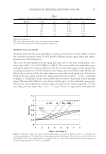
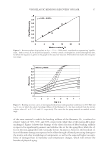
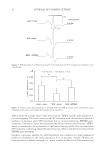
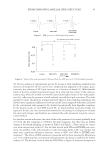
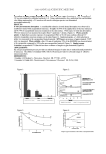
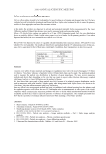
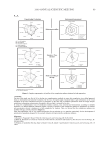
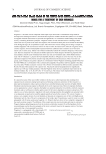
REGENERATION OF NMF 25 sites. Biophysical measurements were made again at 0.25, 0.5, and 4 hours following treatment. TREATMENT These studies compared an untreated control arm to a treated arm that was soaked in warm water. One forearm was soaked in fresh water (temperature 40° ± 2°C) for ten min- utes and blotted dry. The other, unsoaked arm served as control. Biophysical measure- ments were repeated on all test sites 15 minutes, 30 minutes, and four hours after soaking. BIOPHYSICAL INSTRUMENTATION The rates of moisture accumulation (MAT) and water sorption/desorption were measured with a NOVA® Dermal Phase Meter (NOVA® Technology, Portsmouth, NH). The MAT uses changes in skin capacitive reactance (the ratio of charge to potential on an electrically charged isolated conductor) under occlusion by the probe to determine the extent of skin hydration (16). Transepidermal water accumulates under the sensor for twenty seconds and the value is calculated as the slope of the regression line (DPM). The MAT method provides a dynamic measure of SC water handling, as previously reported (17). Skin surface pH was measured using a Courage and Khazaka skin pH meter with a fl at-surface glass electrode. NMF MEASUREMENTS NMF measurement studies followed the NMF collection and analysis protocols set forth in the preceding paper. STATISTICS The biophysical measurements were compared at baseline (prior to treatment), 0.5 hr post-soak and 4 hr post-soak using univariate GLM procedures in SPSS (SPSS, Inc), with time and subject included in the model. The NMF data were normalized (log10) prior to analysis and then compared using univariate GLM measures. The statistical design for the NMF data included tape strip number, treatment, treatment * tape (interaction) and treatment * subject (interaction). A value of ≤ 0.05 was considered statistically signifi - cant in all cases. RESULTS AND DISCUSSION For both studies, at tape 5 and for the sums of tapes 1, 3, and 5, as well as for the sums of tapes 1, 3, 5, and 10, the values at thirty minutes post-soak were signifi cantly lower than both the control and four-hour post soak values for nearly every amino acid, as well as for the summed amino acids (Figure 1). Similar results were seen in Study 2 for tape 3 as for well. These studies show more signifi cant differences between the soaked and control sites than found in our previous study, although directional differences were found in our

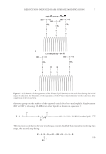
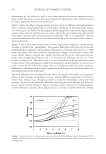
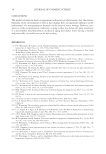
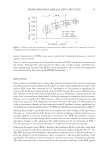
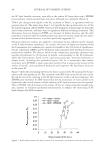
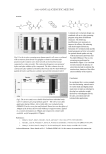
JOURNAL OF COSMETIC SCIENCE 26 previous work. These data clearly show a regeneration or replacement of NMF in the middle layers of the SC four hours after soaking (Figure 1). Figure 2 shows the regenera- tion of citrulline over time over the various tape strip depths. Without the extraction used in previous studies in our laboratory, no signifi cant treatment effects were found at Figure 1. Signifi cant reductions in NMF were observed in the soaked site 30 minutes post-soaking and rebounded to pre-soaking levels or slightly higher by the four-hour post-soak measurement. *Indicates sig- nifi cant difference from the 0.5-hour soak site, p 0.05. Values are displayed as estimated means of the log10 normalized data with errors as ± standard error of the estimated means. These points are drawn from Study 2, tape strip 5. Figure 2. Signifi cant reduction in NMF levels was caused by soaking as measured 30 minutes after the soak, but signifi cant replacement of NMF was only observed in the lower levels of the SC as measured by tape strip depth. *Indicates signifi cant difference from the 0.5-hour soak site, p 0.05 Values are displayed as esti- mated means of the log 10 normalized data with errors as ± standard error of the estimated means.
Purchased for the exclusive use of nofirst nolast (unknown)
From: SCC Media Library & Resource Center (library.scconline.org)