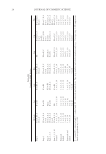
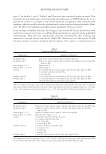
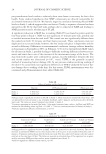
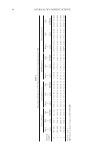
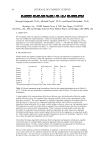
Table I Physiological Parameters of SC Obtained in Successive Strippings (mean ± S.D) Skicon 200 (s) μ Corneometer (a.u.) TEWL (g/m2h) Order parameter S Stripping number Water ↓ water SDS ↓ water SDS ↓ EPDME Water ↓ water SDS ↓ water SDS ↓ EPDME Water ↓ water SDS ↓ water SDS ↓ EPDME Water ↓ water SDS ↓ water SDS ↓ EPDME 1 78* ± 13 39 ± 7 74 + ± 17 39.3 ± 2.5 33.7 ± 1.4 42.0 ± 2.4 7.0 ± 0.6 8.0 ± 0.9 7.0 ± 0.6 0.553* ± 0.004 0.525 ± 0.005 0.546* ± 0.005 2 103 ± 18 58 ± 12 104 ± 26 41.3 ± 2.2 35.4 ± 1.6 45.2 ± 2.9 8.5 ± 0.9 9.7 ± 1.2 8.0 ± 1.0 0.574* ± 0.005 0.552 ± 0.003 0.563* ± 0.004 3 94 ± 14 108 ± 30 146 ± 30 40.0 ± 2.7 37.9 ± 2.4 45.6 ± 3.0 10.9 ± 1.1 12.8 ± 1.3 10.6 ± 1.5 0.584* ± 0.003 0.564 ± 0.004 0.575* ± 0.003 4 174 ± 50 174 ± 57 274 ± 113 44.1 ± 2.8 39.3 ± 2.9 52.2 ± 3.6 14.4 ± 2.3 19.4 ± 3.0 17.8 ± 5.1 0.588* ± 0.002 0.574 ± 0.004 0.584* ± 0.003 *p + p SDS→water vs water→ water or SDS→EPDME. JOURNAL OF COSMETIC SCIENCE 44

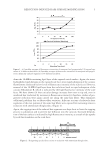
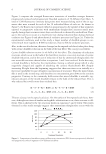
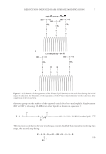
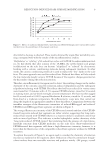
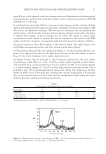
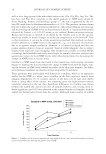
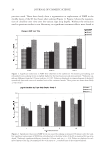
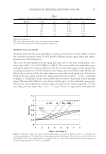
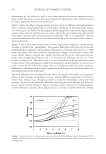
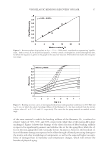
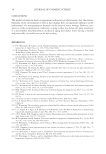
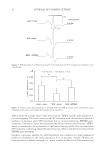
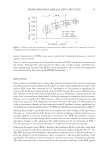
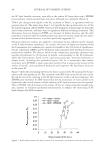
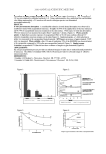
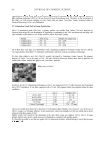
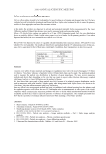
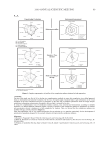
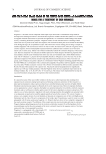
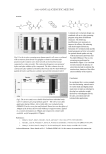
EPDME IMPROVES LAMELLAR LIPID STRUCTURE 45 (6). Precise analysis of experimental spectra by means of slow-tumbling simulation has also been developed (5,18,19), and we have employed this approach to investigate quan- titatively the ordering of SC lipid structure as a function of depth (2). Multilamellar lipids of the fi rst stripped (outermost) layers show relatively low values of the order pa- rameter (S0), while the middle to lower SC layers show higher values of the order param- eter (S0), refl ecting the presence of well-ordered intercellular lipid structures. The order parameter values obtained for normal untreated skin by slow-tumbling simulation (S0) showed more signifi cant differences between each SC layer compared with those indicated by the conventional order parameter (S) calculated geometrically from hyperfi ne couplings. In the present study, we used SDS-treated SC, in which marked structural change was expected. In this case, the conventional method for calculating S is adequate to evaluate the structural changes, and therefore we evaluated the order parameter using the conven- tional method. For the skin treated with water, the value of the order parameter S increased gradually from 0.553 for the fi rst stripping to 0.588 for the third stripping, but there was no further change at the fourth stripping, as shown in Table I and Figure 4. These values are consis- tent with our previous results (2). For the skin treated with SDS and EPDME post-treat- ment, the profi les of the order parameter with increasing depth of SC were similar, but there were signifi cant differences between “water vs SDS” and “SDS vs EPDME post- treatment”. The effects of SDS treatment correspond well to those reported by Mizushima et al. (15), confi rming that conventional order parameter calculation is suffi cient for further analysis (2). The decrease in the S value by SDS (Table I Figure 4) indicates disruption of Figure 5. EPR spectra of 5-DSA-labeled liposomes. Figure 6. Values of the order parameter S obtained from the EPR spectra of 5-DSA-labeled liposomes.
Purchased for the exclusive use of nofirst nolast (unknown)
From: SCC Media Library & Resource Center (library.scconline.org)